

Since 2014, we have provided advanced visualization and analysis of climate and Earth observations data through our App and API
Capabilities of the Climate Engine App and API
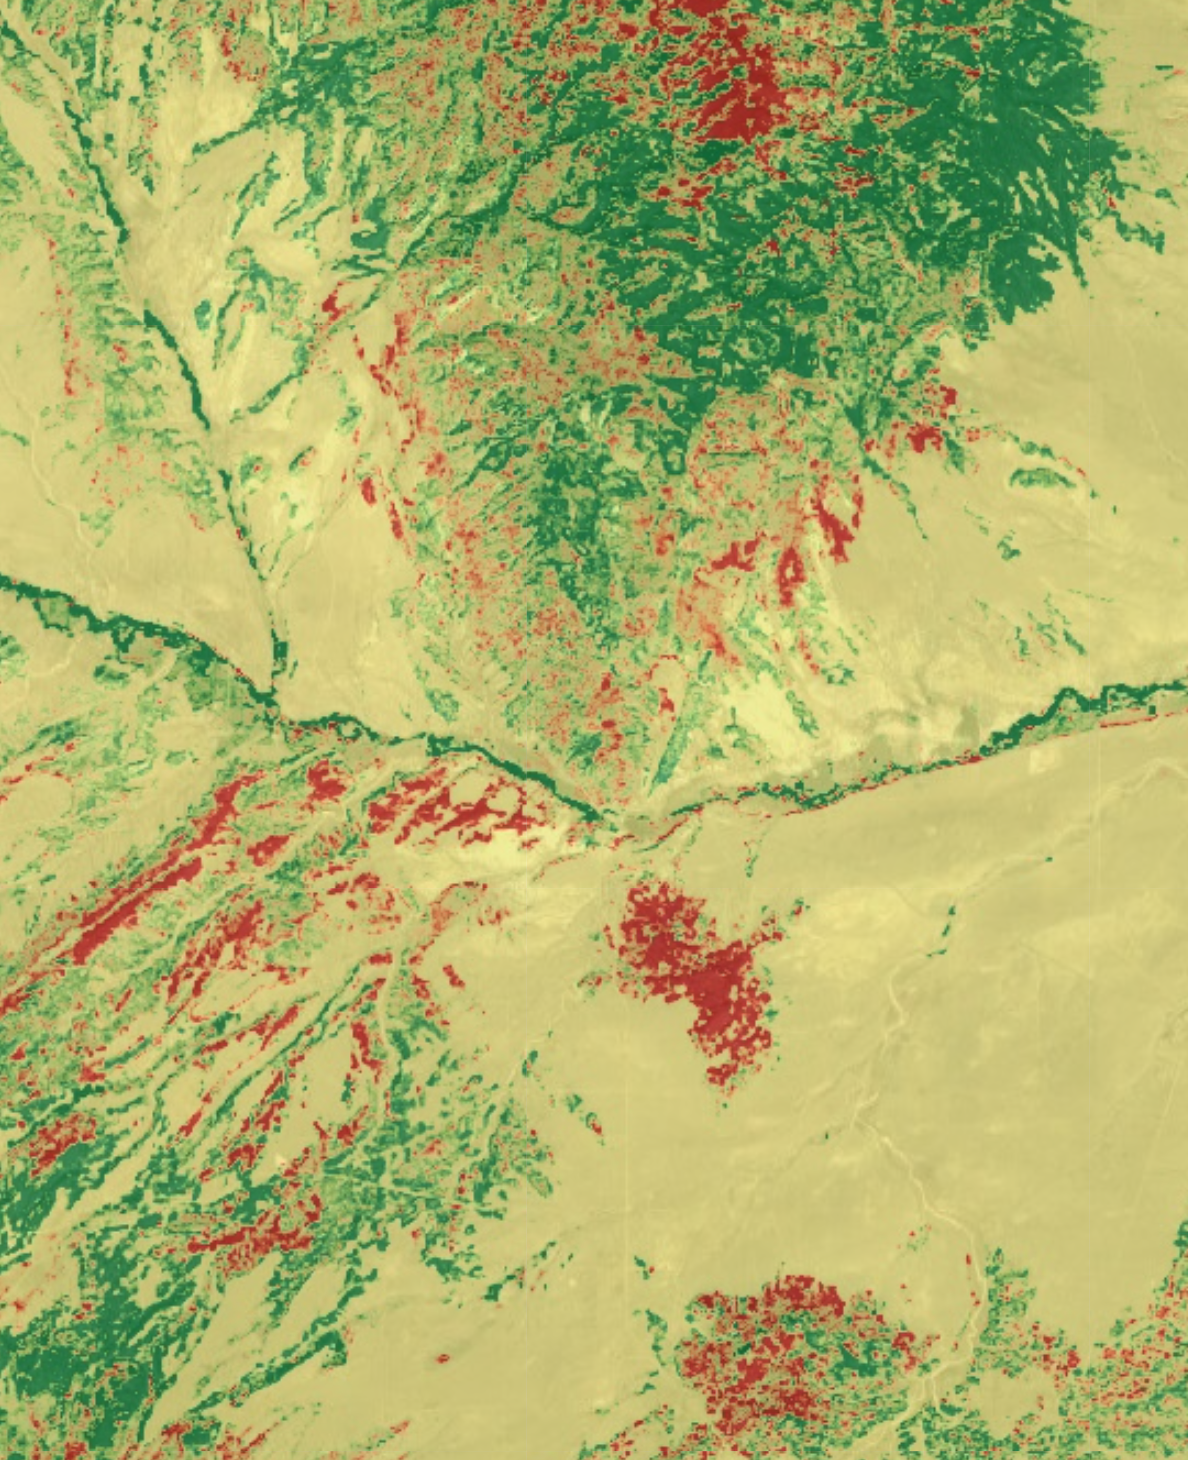
Visualize.
Unprecedented access for visualizing and interacting with Earth observation datasets on the fly in your browser, with no additional software required. Provides capability for on-demand value, percentile, trend, and anomaly mapping.
Analyze.
Generate advanced charts to crunch the numbers on the fly. Plot types include time-series plots, two-variable time-series plots, summary time-series plots, and two-variable scatterplots. Additional capabilities include significance testing in mapping and charting.
Export.
You can do a lot with Climate Engine tools, but sometimes you just need the data somewhere else. You can export raster data as TIFF, PNG, and JPEG images and can export time-series data as CSV and XLSX data tables so that you can take your data into GIS, statistical software, and more.
Share.
Every map and chart you produce in the Climate Engine App can be easily shared by creating a short link. Short links are unique links that can be used to allow your colleagues, friends, or future self to access your data at a later point and to increase reproducibility of your analysis.

About the initiative
Climate Engine tools use Google Earth Engine for on-demand processing of satellite and climate data on a web browser and features on-demand mapping of environmental monitoring datasets, such as remote sensing and gridded meteorological observations. With fully customizable analyses, the Climate Engine App enables the user to produce maps and time series summaries from these datasets.
The Climate Engine App is unique in that it provides unprecedented access to visualization, analysis, and download of Earth observation datasets without the need to code. And because it leverages cloud technologies, it overcomes the computational limitations of big data for use in real-time monitoring and in research contexts. It provides the ability to simply download or share results instead of processing entire data archives locally. The App is fully customizable for spatial and temporal analyses. Metrics available for processing include a comprehensive set of variables that provide early warning indicators of climate impacts such as drought, wildfire, ecological stress, and agricultural production.
Citing Climate Engine
To cite a figure/map produced the Climate Engine App or API, please use the following citations:
Climate Engine. (year). Desert Research Institute and University of California, Merced. Accessed on (date). http://climateengine.org, version 2.1.
Huntington, J., Hegewisch, K., Daudert, B., Morton, C., Abatzoglou, J., McEvoy, D., and T., Erickson. (2017). Climate Engine: Cloud Computing of Climate and Remote Sensing Data for Advanced Natural Resource Monitoring and Process Understanding. Bulletin of the American Meteorological Society, http://journals.ametsoc.org/doi/abs/10.1175/BAMS-D-15-00324.1