Using the Drought Reports Version 2
Generate Custom Reports
Want to generate Climate Engine Drought Reports for your own area of interest? Learn more in Generating Custom Drought Reports.
Introduction
Drought is a primary driver of vegetation production, water availability, and wildfire risk across the conterminous United States, but its impacts are difficult to summarize with a single indicator or map. In management settings, drought may appear as reduced water supplies, poor forage production, stressed vegetation, declining soil moisture, poor snowpack carryover, or a mismatch between precipitation totals and observed conditions on the ground. These challenges are especially pronounced in the West, where warm temperatures and high evaporative demand can intensify impacts even when precipitation is near average.
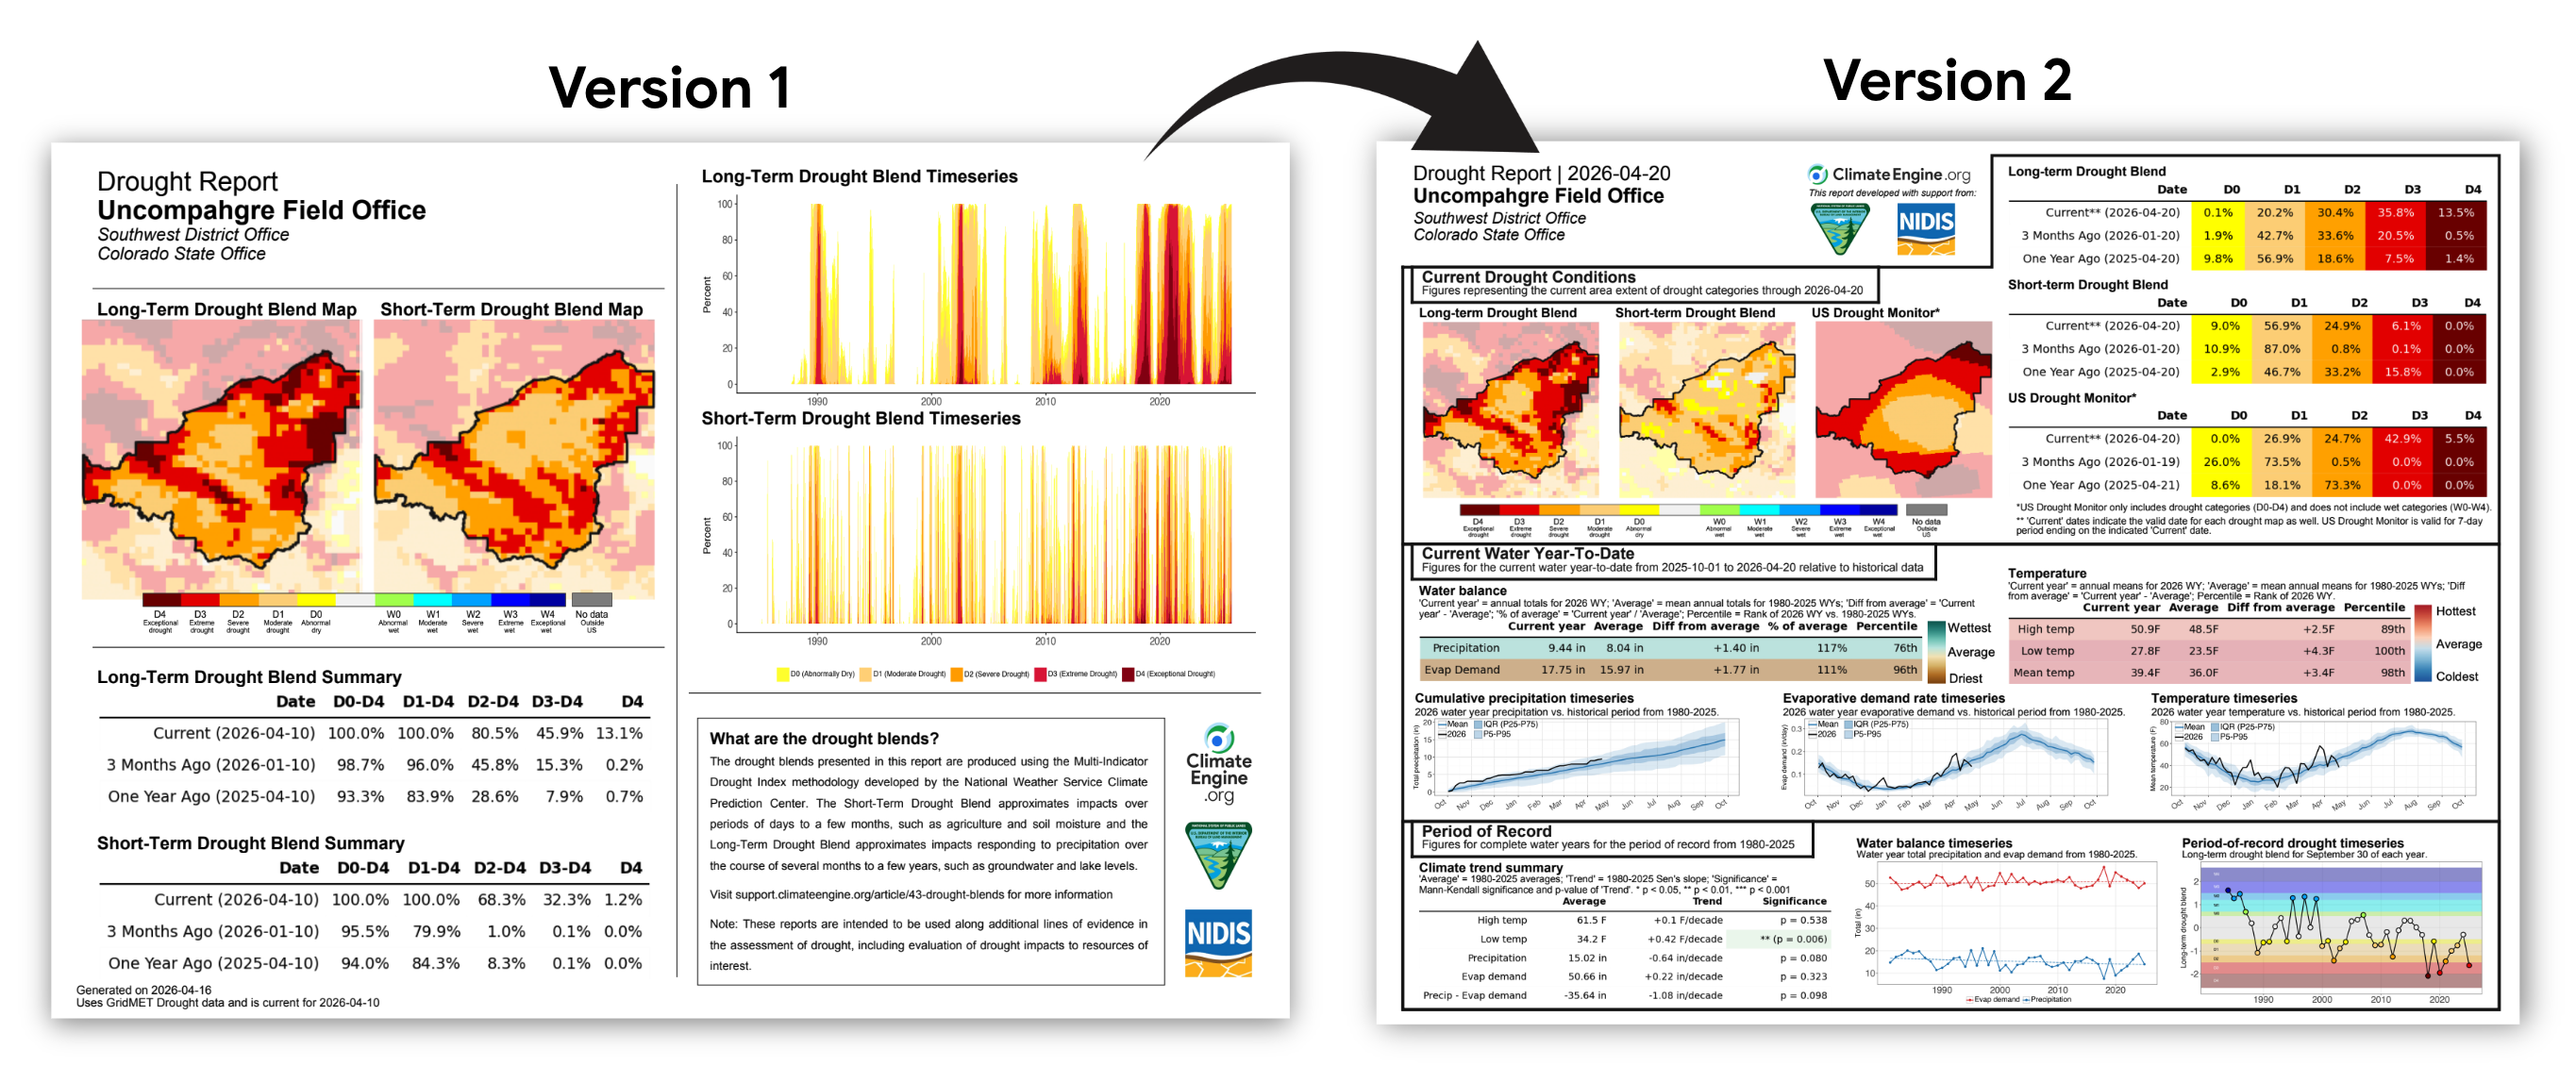
To help resource managers interpret drought conditions at relevant scales, Climate Engine has partnered with the Bureau of Land Management (BLM) and NOAA's National Integrated Drought Information System to produce consistent, up-to-date drought reports for any user-defined area of interest. Version 2 of the Climate Engine Drought Reports is designed to represent drought complexity in an accessible, interpretable format. Each report presents multiple drought and meteorological indicators in a single-page summary, with a second page that guides interpretation and use. Reports can be generated for any location and rerun every five days as new data become available.
Version 2 expands on the original report by incorporating new datasets and variables, including the U.S. Drought Monitor, gridMET climate variables, and revised drought category summaries. These additions are presented alongside the long-term and short-term drought blends from Version 1 to provide a more complete view of current drought conditions and their climatic context.
As with all Climate Engine reports, the Drought Reports version 2 can be accessed in two ways:
- By using the custom reporting tool.
- By accessing pre-computed reports for Bureau of Land Management land units.
Access Drought Reports v2 for BLM Land Units
Access Drought Reports for BLM grazing allotments, district offices, field offices, and state offices at https://reports.climateengine.org/droughtv2
Datasets and Variables
Climate Engine Drought Reports version 2 integrate three main data sources to describe drought conditions within an area of interest:
- U.S. Drought Monitor for categorical drought classes from D0 to D4.
- Short-term and long-term drought blends, calculated using gridMET Drought, for continuous drought conditions across different time scales.
- gridMET climate variables, including precipitation, evaporative demand, and temperature. Precipitation and evaporative demand are reported in inches, while temperature is reported in degrees Fahrenheit.
Together, these datasets allow the report to show both current drought status and the climatic conditions contributing to drought risk. Version 2 expands on Version 1 by adding the U.S. Drought Monitor, introducing current water-year climate summaries, and revising drought summary tables to report the percent of the area of interest in each category rather than cumulative totals.
The climate sections place current conditions in context by summarizing water-year-to-date and period-of-record patterns in precipitation, evaporative demand, and temperature. These summaries help users interpret whether drought conditions are short-term, persistent, or being intensified by unusually warm and atmospherically demanding conditions.
A few additional notes are important for interpreting the report:
- Evaporative demand represents the atmospheric demand for water. It is influenced by temperature, humidity, wind speed, and solar radiation, and is calculated as the ASCE grass reference ET (ETo).
- A water year runs from October 1 through September 30 and is labeled by the calendar year in which it ends. The report presents both water-year-to-date information in the Current Water Year-to-Date section and complete water-year information in the Period of Record section.
- Unless otherwise noted, historical comparisons use the period from 1980 through the previous complete water year.
Report Structure
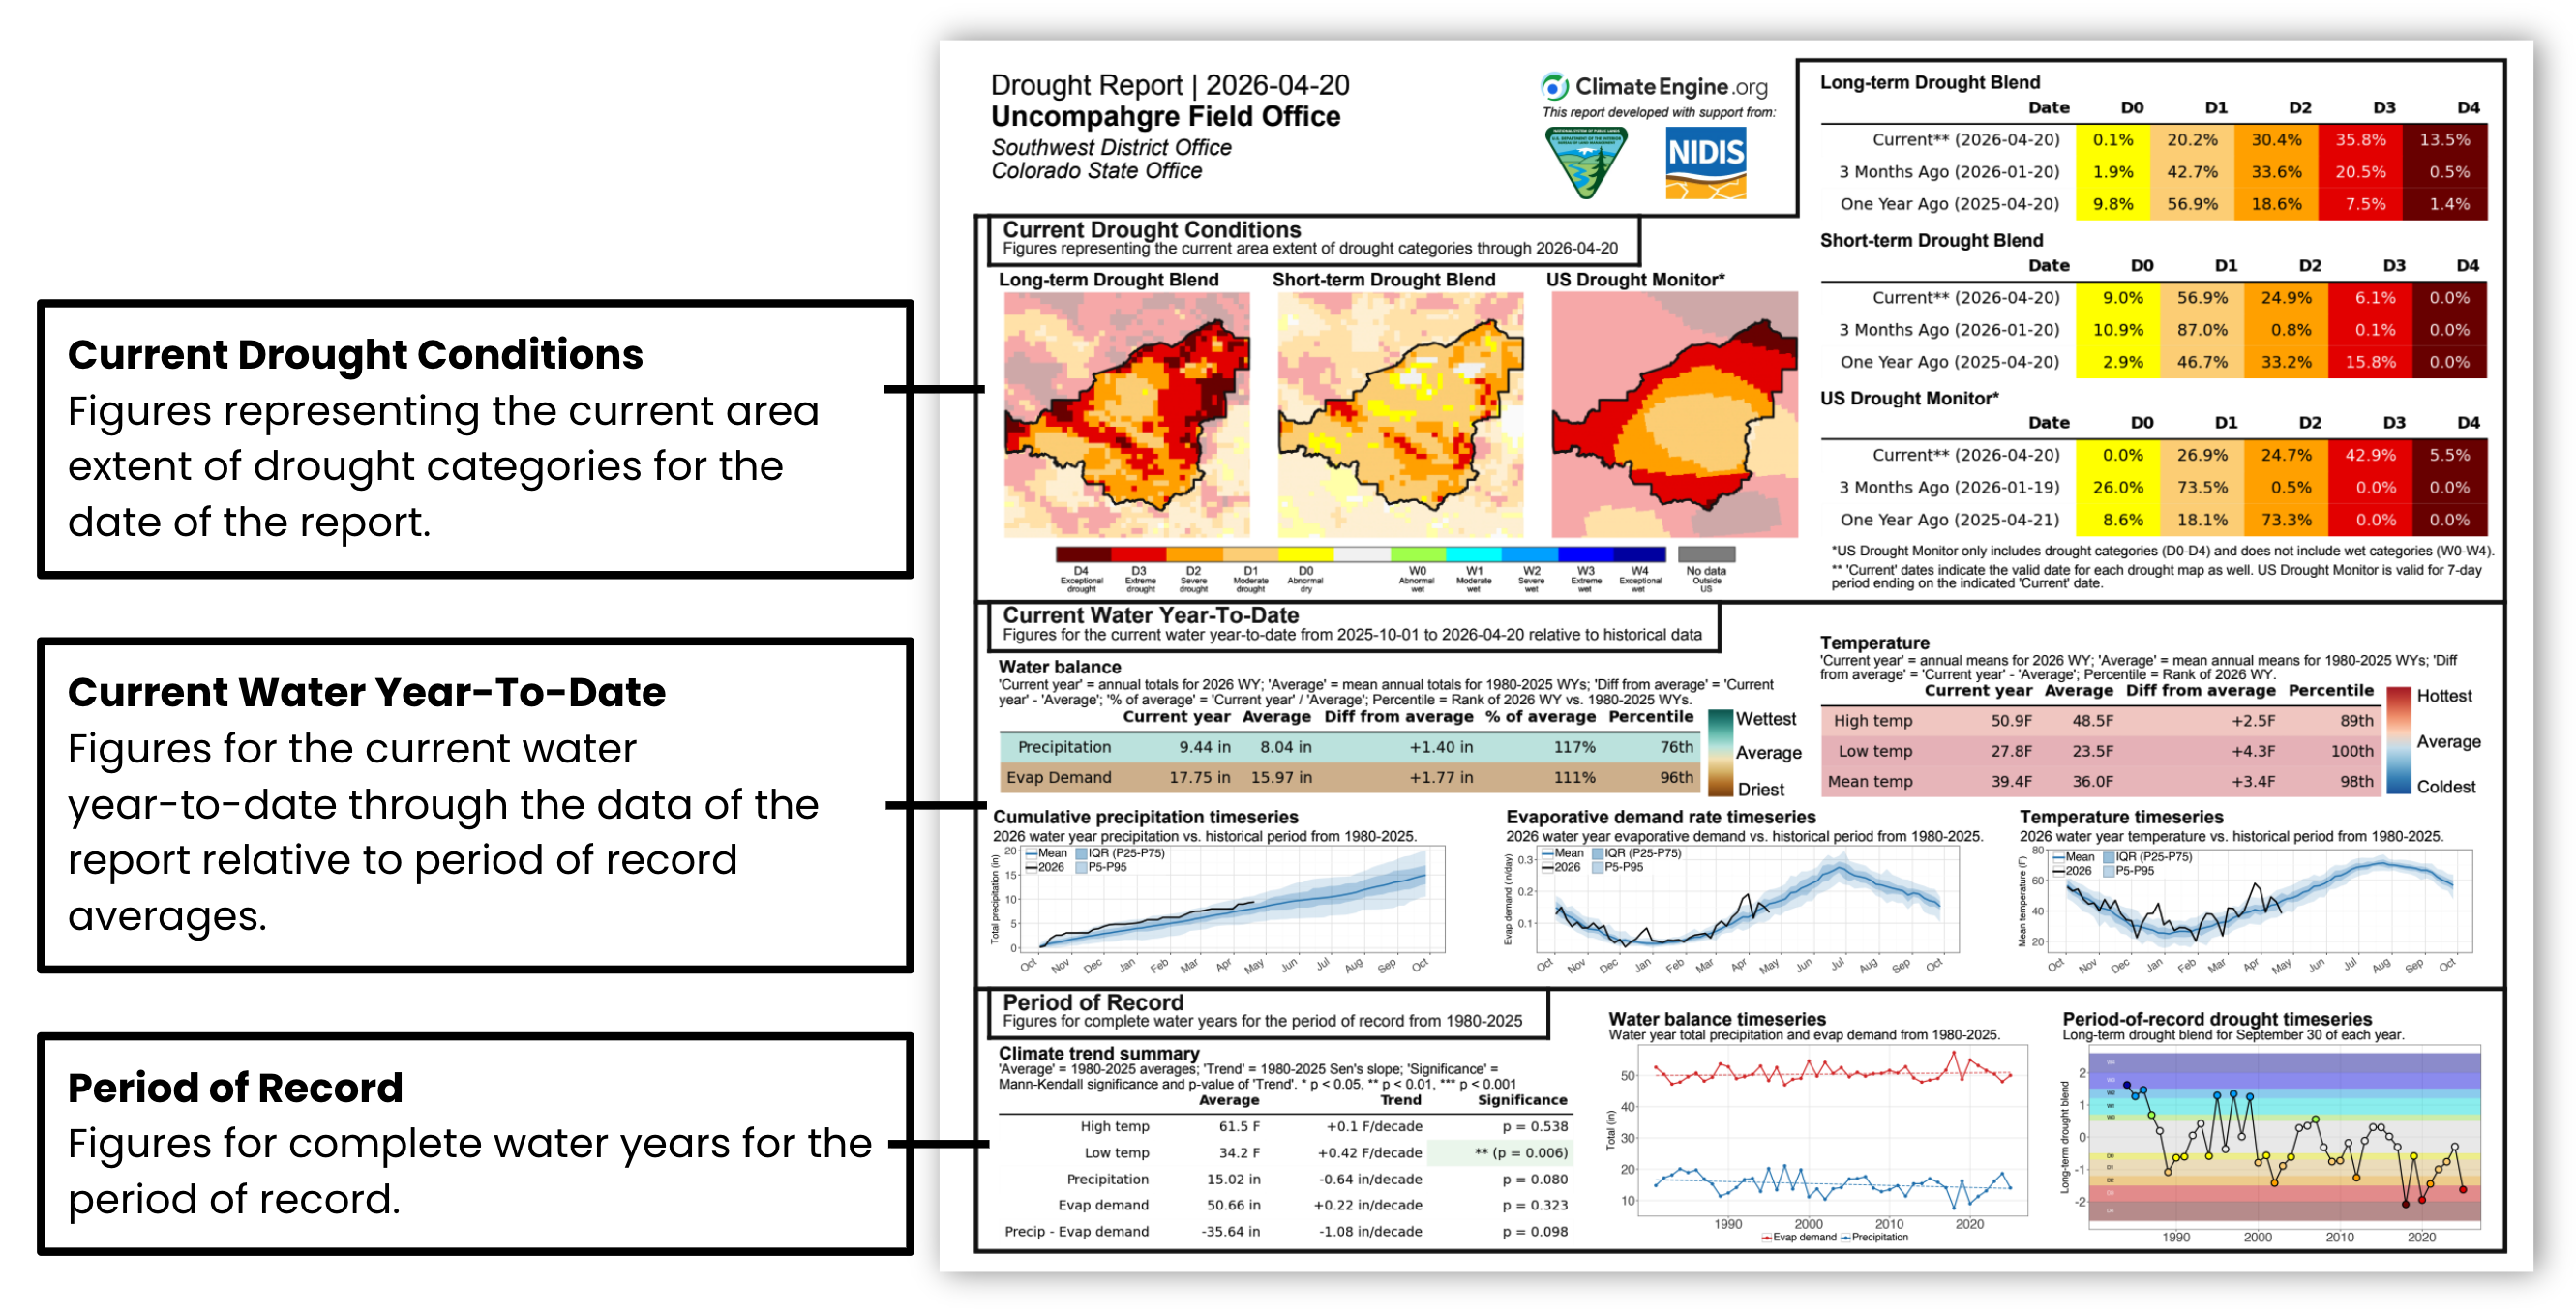
The updated Drought Reports are organized into three sections:
- Current Drought Conditions
- Current Water Year-to-Date
- Period of Record
This structure moves from current drought status, to the current water-year climate drivers, to longer-term climate and drought context.
The following sections describe the purpose, interpretation, and major updates for each part of the report. Throughout, we use the example of a Bureau of Land Management field office, but the principles can be applied to any area of interest, including states, counties, municipalities, agency management units, and other user-defined areas.
Current Drought Conditions
Addition of U.S. Drought Monitor
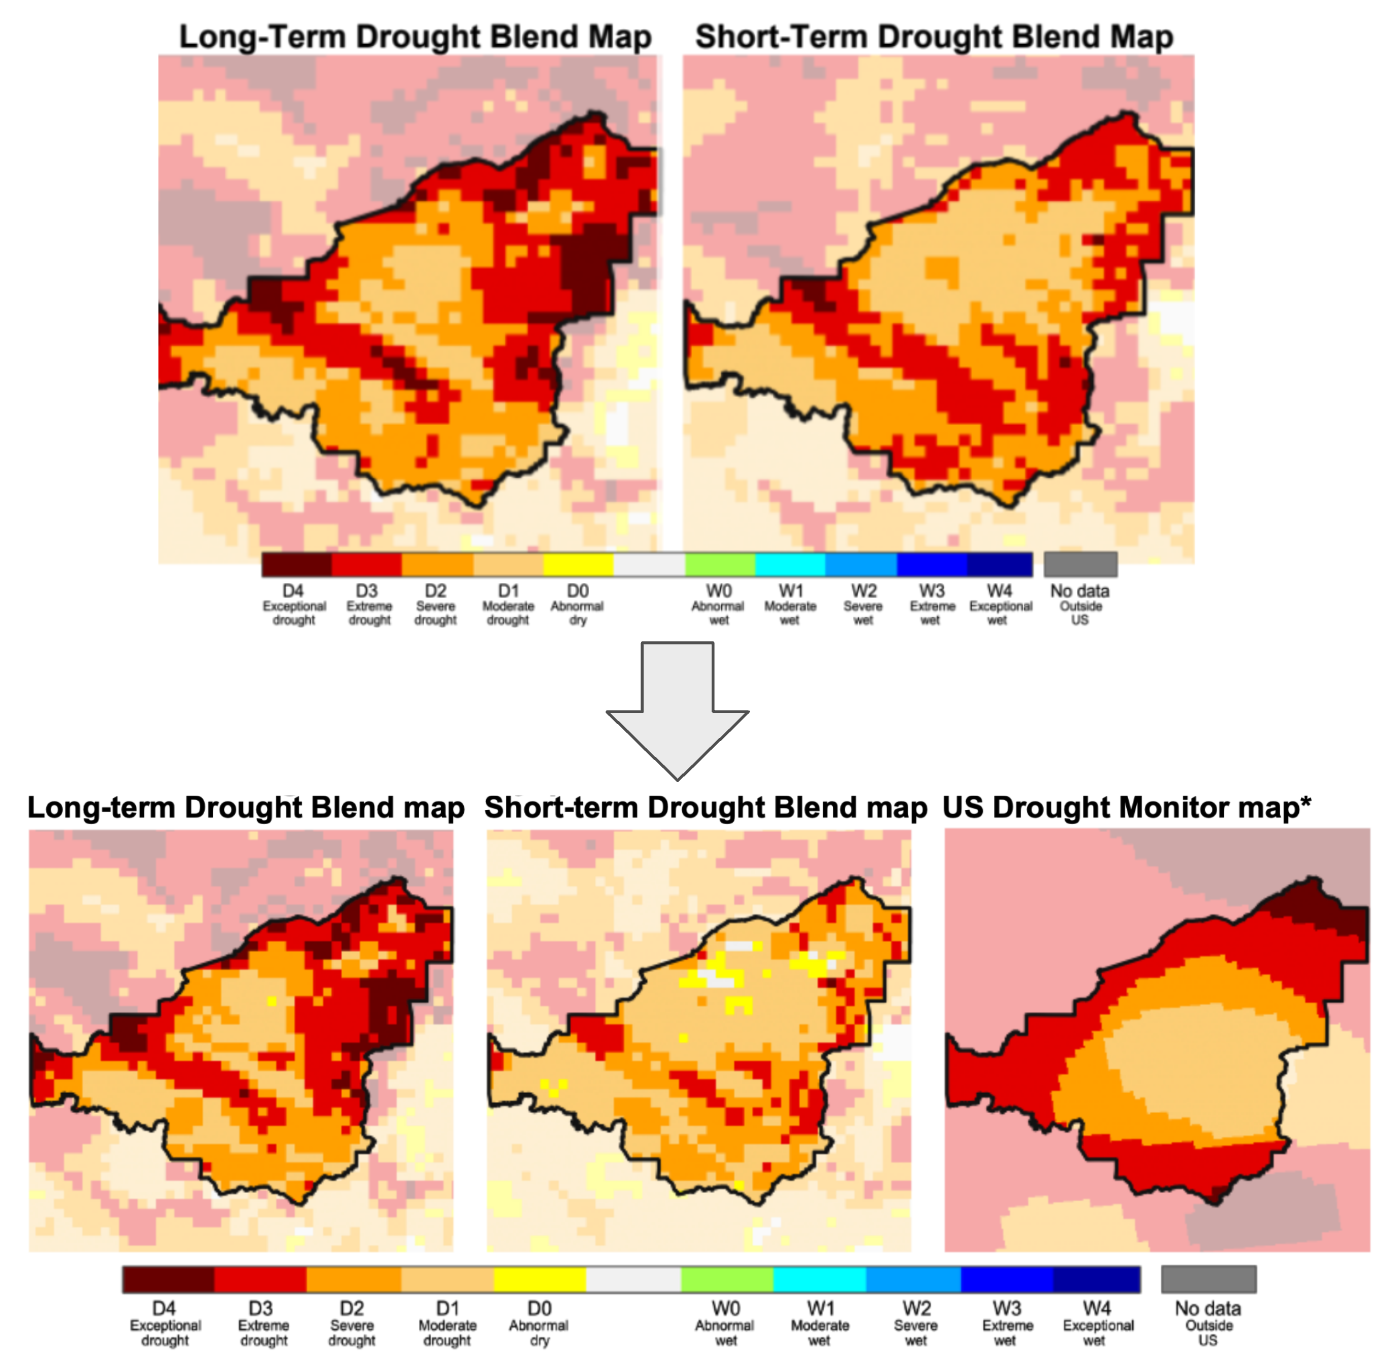
Version 1 of the Climate Engine Drought Reports presented maps of the short-term and long-term drought blends to show the spatial distribution of drought classes over two different drought timescales. Version 2 adds the U.S. Drought Monitor, providing an impact-based perspective on drought status.
The U.S. Drought Monitor and the drought blends are complementary, not interchangeable. The U.S. Drought Monitor reflects an expert-synthesized assessment of drought conditions, while the short-term and long-term drought blends provide spatially continuous gridded indicators derived from climate and drought datasets. Differences among the maps can help identify where drought signals are consistent across indicators and where conditions require closer interpretation. Because the U.S. Drought Monitor and gridMET Drought products have different update schedules, their valid dates may not always match exactly.
Drought Category Updates
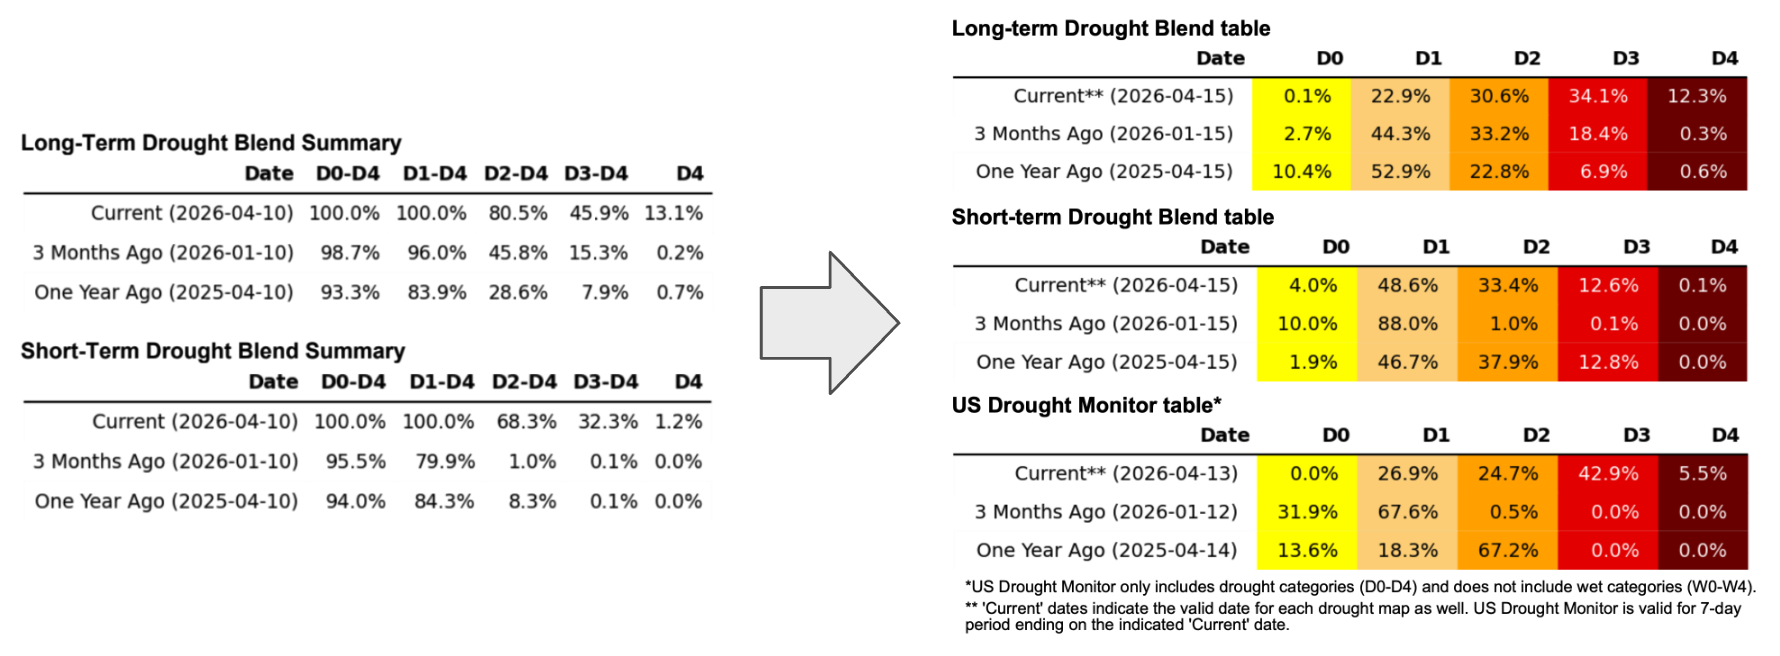
Version 1 summarized drought extent using cumulative categories. For example, a D1-D4 value represented the percent of the area of interest in moderate drought or worse, and a D2-D4 value represented the percent in severe drought or worse. Version 2 reports class-specific percentages instead.
In Version 2, the D0, D1, D2, D3, and D4 columns represent the percent of the area of interest falling specifically within each category, rather than cumulative totals. This makes it easier to identify whether drought severity is concentrated in one class or spread across multiple classes. Class-specific percentages should sum to approximately 100%, excluding no-data areas and rounding.
Current Water Year-to-Date
Version 2 introduces current water-year-to-date tables and timeseries figures. The tables provide a snapshot of cumulative precipitation, cumulative evaporative demand, and average temperature conditions over the water year to date. The timeseries figures complement this snapshot by showing the timing and sequence of conditions within the same period. This allows users to identify when precipitation events occurred, how long dry or wet spells persisted, and when temperature or evaporative demand spikes took place relative to historical data. Together, these two views provide a more complete picture of current water-year conditions.
Water Balance Summary Table
The Water balance summary table provides key statistics for water-year-to-date precipitation and evaporative demand. Rows are color-coded to indicate whether current water-year-to-date conditions are more consistent with wetter or drier atmospheric water-balance conditions. For precipitation, higher percentiles generally indicate wetter conditions. For evaporative demand, higher percentiles indicate greater atmospheric demand for water and therefore greater drying pressure.
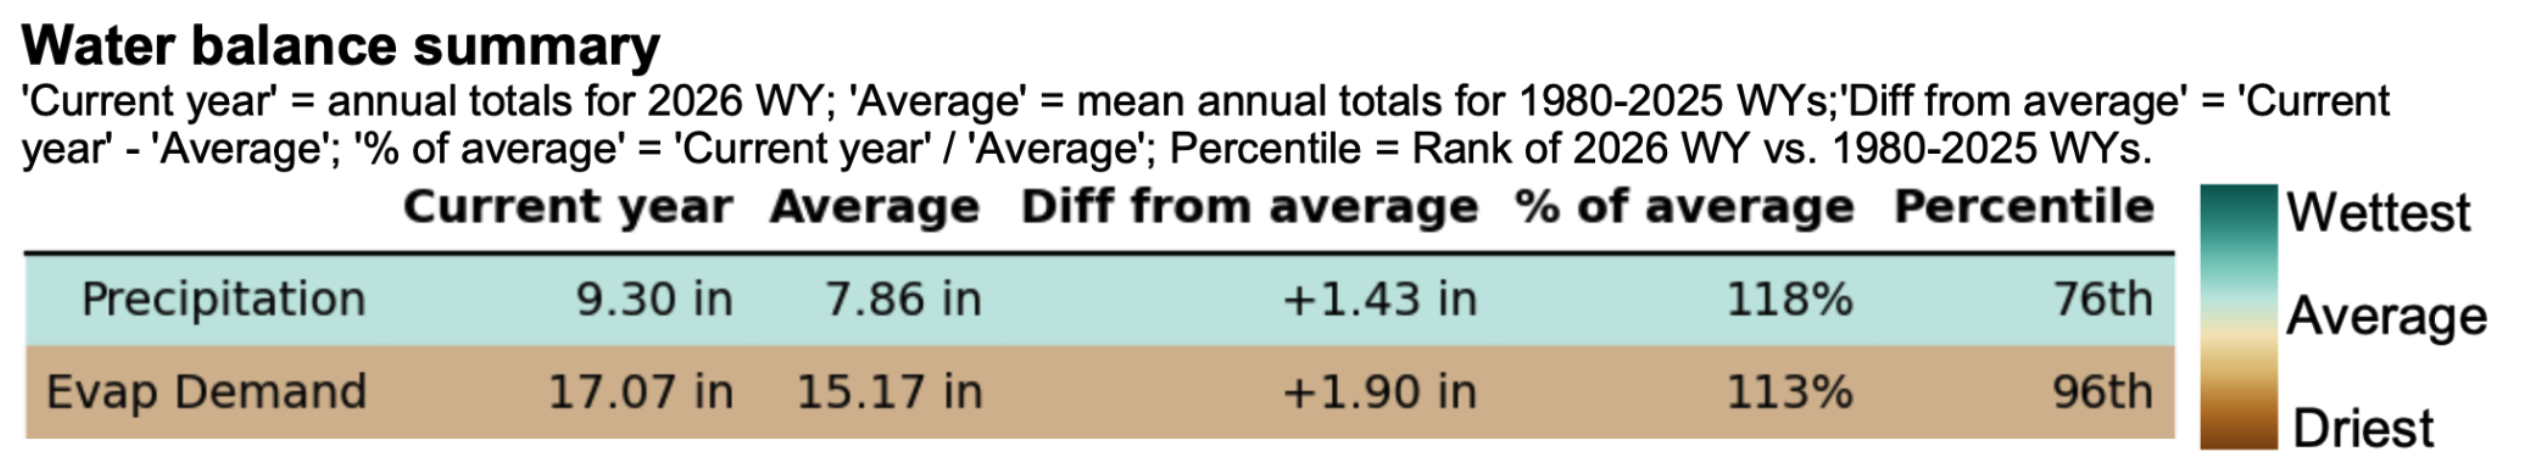
The table columns include:
- Current water-year-to-date values.
- The 1980-previous year average for the same time period as the current water year-to-date value.
- The difference between the current value and the historical average.
- The current value as a percent of the historical average.
- The percentile of the current value relative to all years from 1980 through the previous year for the same time period.
In this example, the area of interest has received more precipitation than typical for this time of year, while evaporative demand has also been unusually high. In practical terms, above-average precipitation may be offset by strong atmospheric drying demand, increasing the potential for soil moisture depletion, vegetation stress, and reduced persistence of wet-period benefits.
Note
The water balance table summarizes cumulative water-year-to-date precipitation and cumulative evaporative demand. The evaporative demand timeseries shows the rate of evaporative demand through the current water year, allowing users to identify short-duration periods of unusually high atmospheric drying demand.
Temperature Summary Table
The Temperature summary table provides key statistics for water-year-to-date temperature values, including high, low, and mean temperature. Temperature rows are color-coded by percentile rank, with warmer colors indicating unusually warm conditions and cooler colors indicating unusually cool conditions for the same water-year-to-date period.
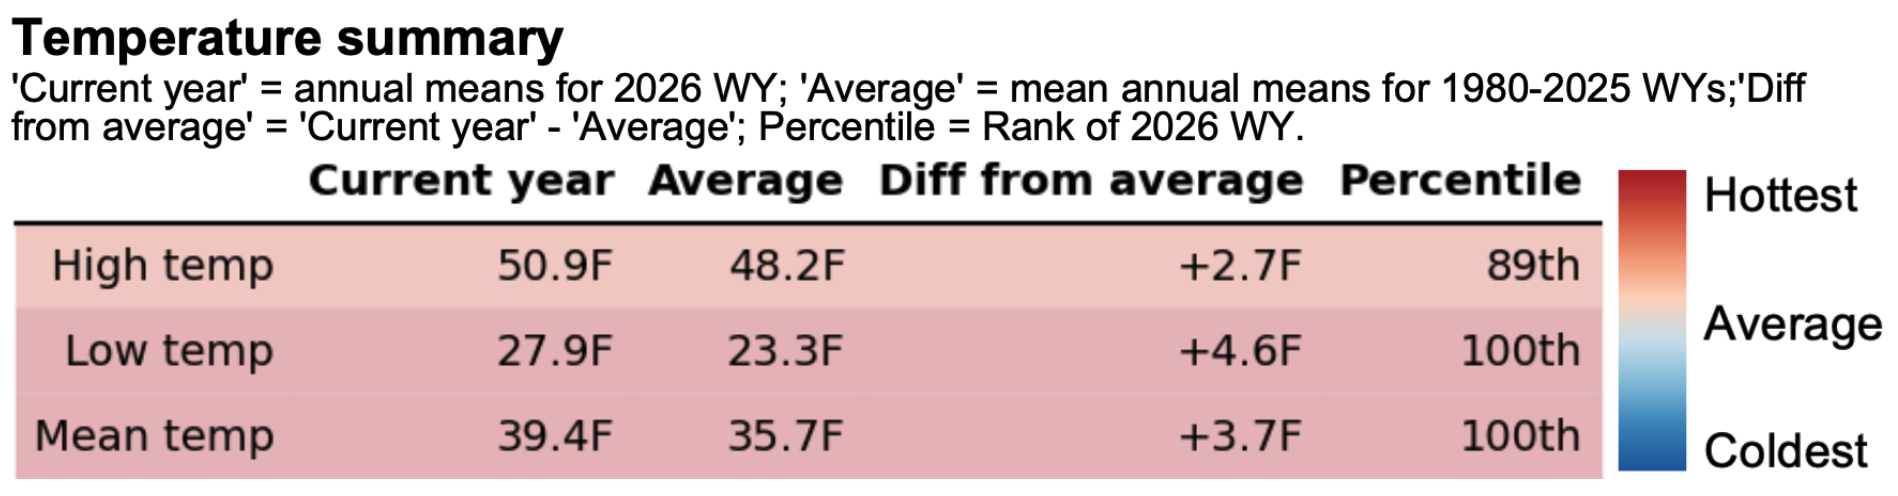
The table columns include:
- Current water-year-to-date values.
- The 1980-previous year average for the same time period as the current water year-to-date value.
- The difference between the current value and the historical average.
- The percentile of the current value relative to all years from 1980 through the previous year for the same time period.
In this example, sustained above-average heat helps explain the exceptional evaporative demand for the water-year-to-date period. This heat can contribute to evaporative drought even during a wetter-than-average period.
Current Year Cumulative Precipitation Timeseries
The Current year cumulative precipitation timeseries figure displays water-year-to-date precipitation plotted against the historical distribution from 1980 through the previous year. In addition to current values, the timeseries includes the historical mean, interquartile range from the 25th to 75th percentile, and 5th to 95th percentile envelope.
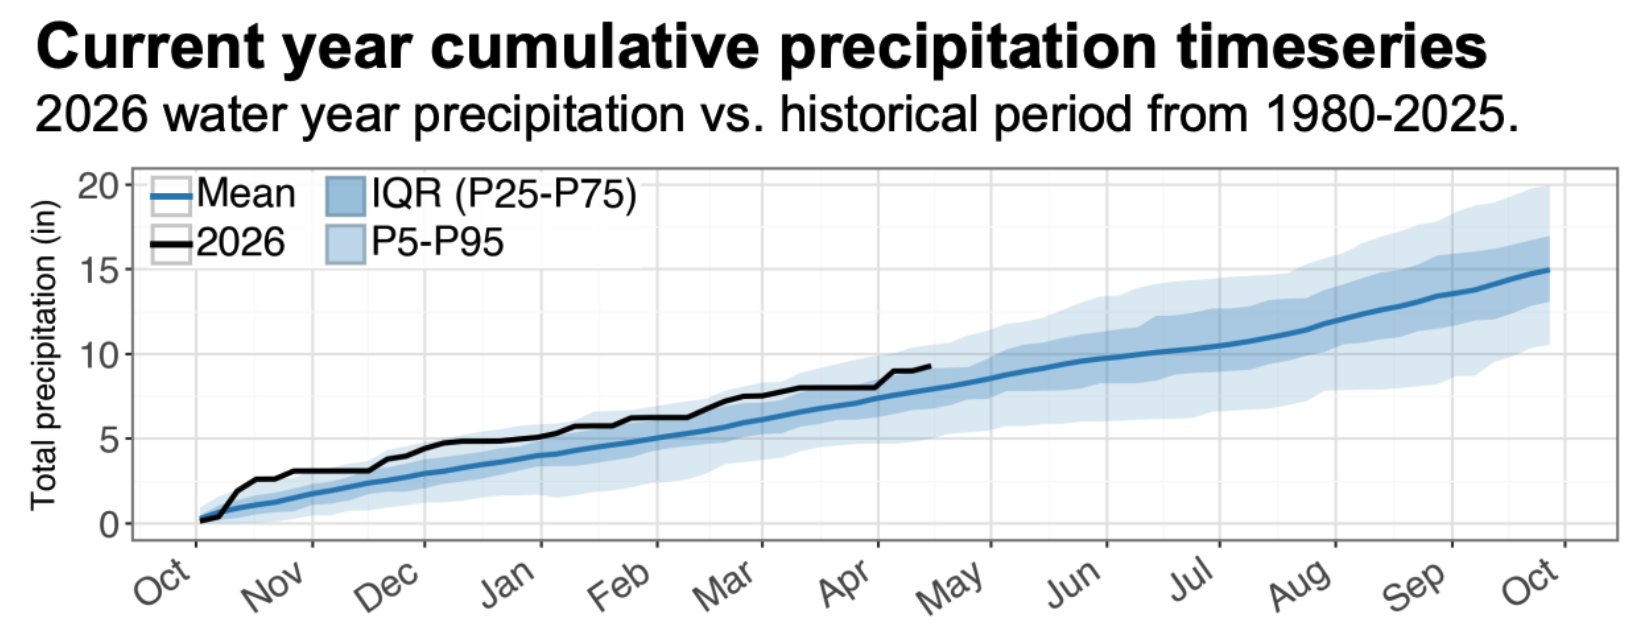
This example shows consistently elevated precipitation accumulation since the start of the water year, indicating a wetter-than-average water year to date.
Current Year Evaporative Demand Rate Timeseries
The Current year evaporative demand rate timeseries figure reports water-year-to-date evaporative demand values compared to the historical period from 1980 through the previous year. In addition to current values, the timeseries includes the historical mean, interquartile range from the 25th to 75th percentile, and 5th to 95th percentile envelope.
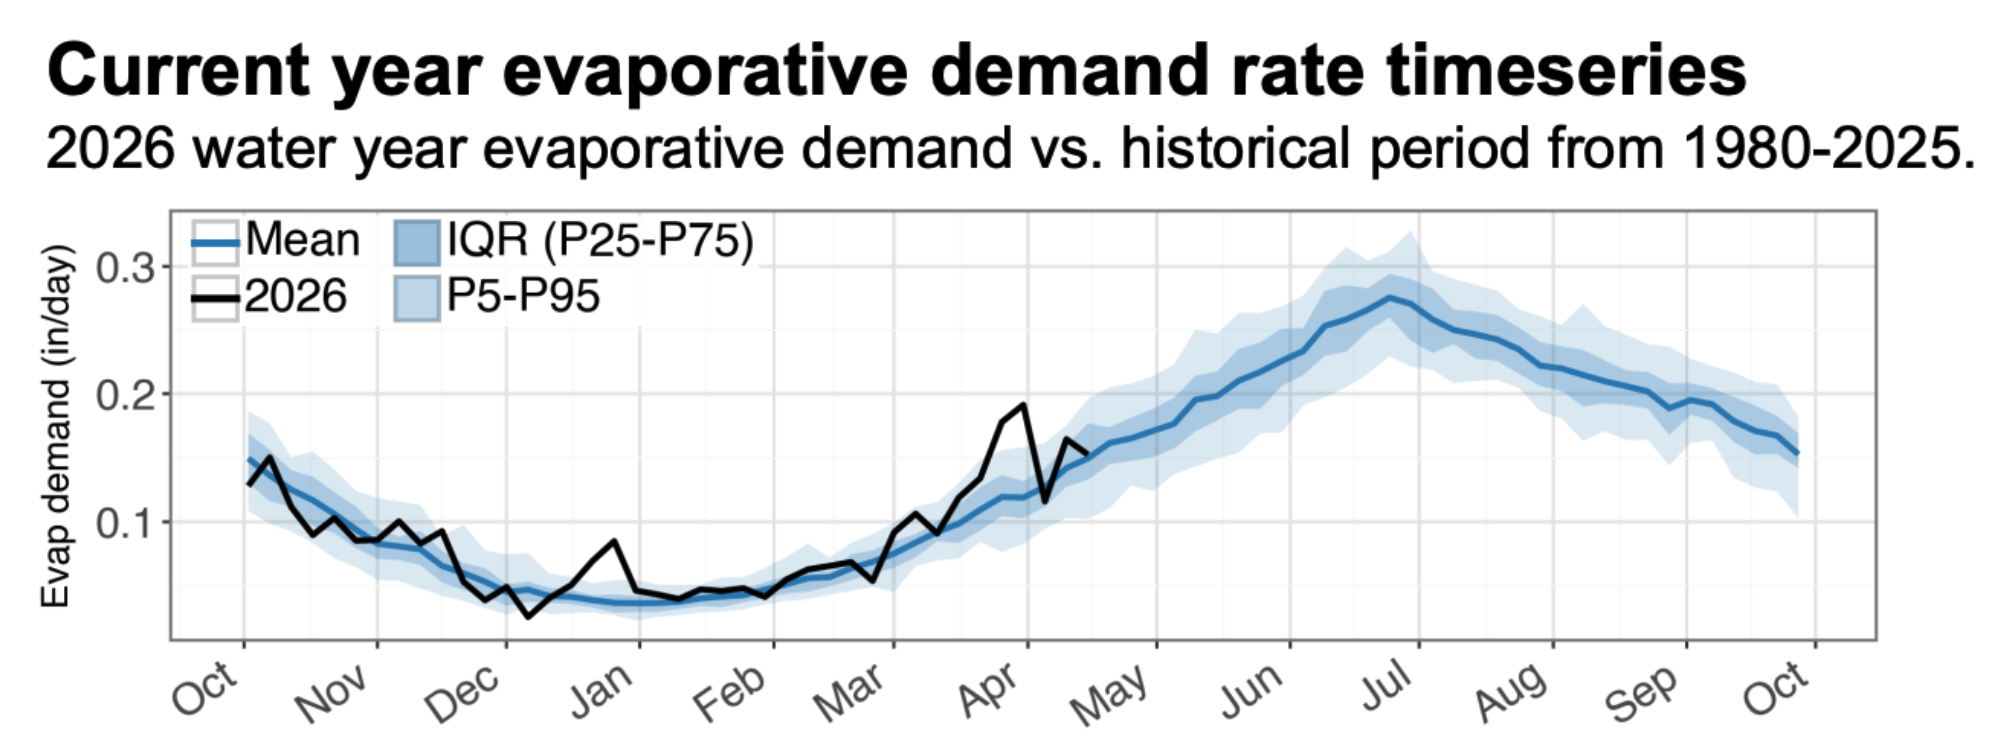
This example shows well-above-average evaporative demand during November, December, and March. In particular, spikes in late December and March exceeded the 95th percentile, indicating evaporative demand rates near the upper end of the approximately 40-year record. The March event may have contributed to rapid early-season snowmelt and increased soil moisture loss in this region.
Current Year Temperature Timeseries
The Current year temperature timeseries figure reports water-year-to-date temperature values compared to the historical period from 1980 through the previous year. In addition to current values, the timeseries includes the historical mean, interquartile range from the 25th to 75th percentile, and 5th to 95th percentile envelope. Temperature is an important driver of evaporative demand.
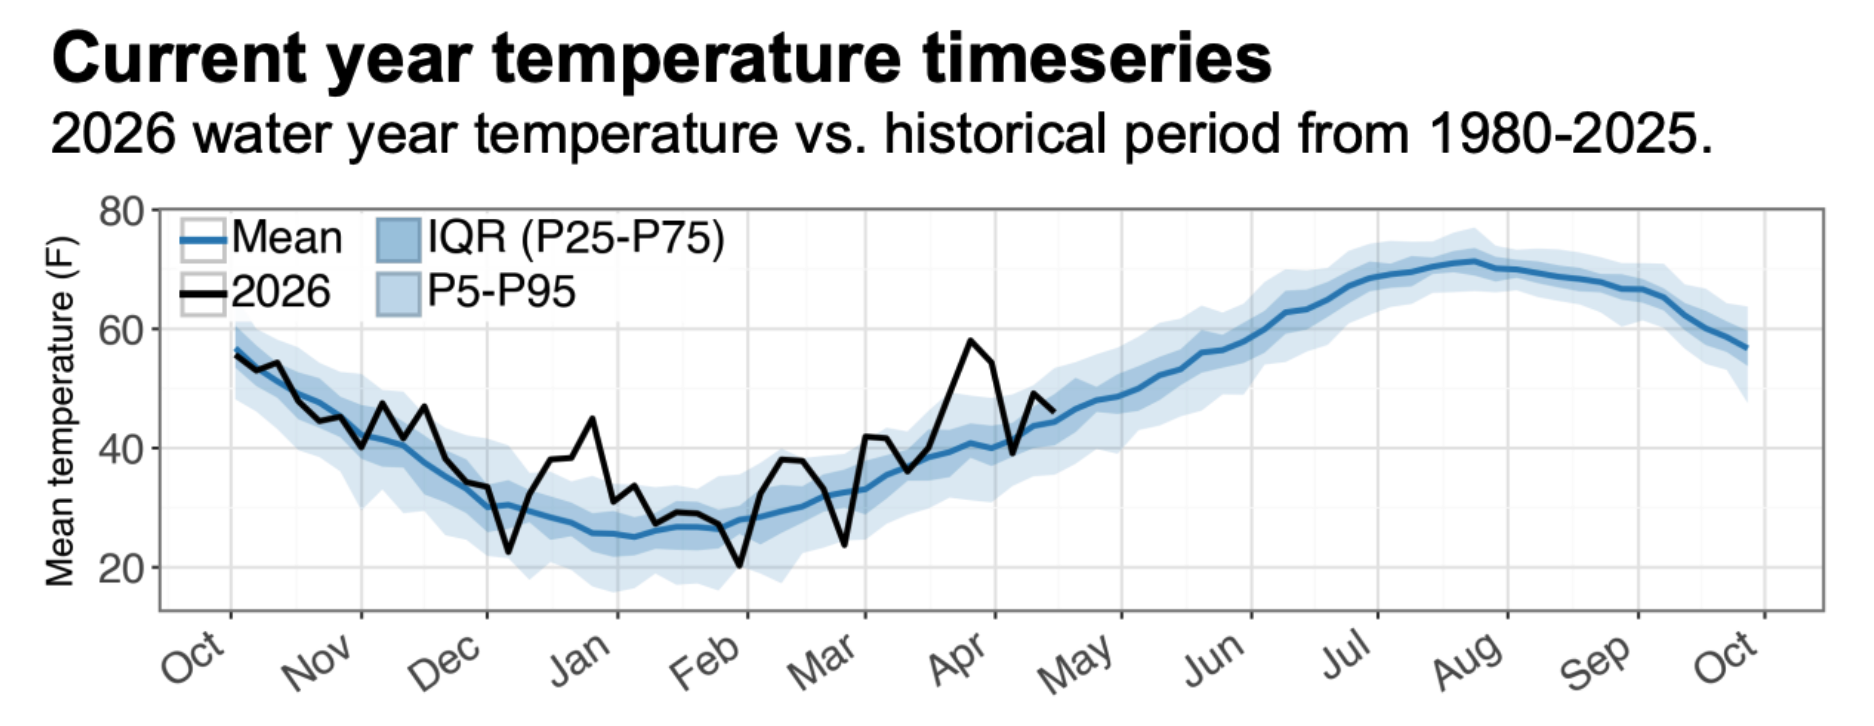
This example shows well-above-average temperatures during November, December, February, and March. Spikes in late December and March exceed the 95th percentile, indicating conditions near the warmest observed during the approximately 40-year record.
Period of Record
Version 2 introduces climate trend summary tables and timeseries figures to provide insight into how temperature and water-balance conditions have changed over the 1980-through-previous-year period of record. The trend summaries quantify the direction, magnitude, and statistical significance of long-term changes for each variable, while the timeseries plots provide annual values with trend lines to show the trajectory and variability behind those statistics.
Climate Trend Summary Table
The Climate trend summary table provides key trend statistics for temperature and water-balance variables over the 1980-through-previous-year period of record, including trend magnitude, direction, and statistical significance for each variable. Trends are estimated using Sen's slope, and statistical significance is assessed using the Mann-Kendall test. These trend summaries describe historical direction and magnitude over the period of record; they should not be interpreted as forecasts.
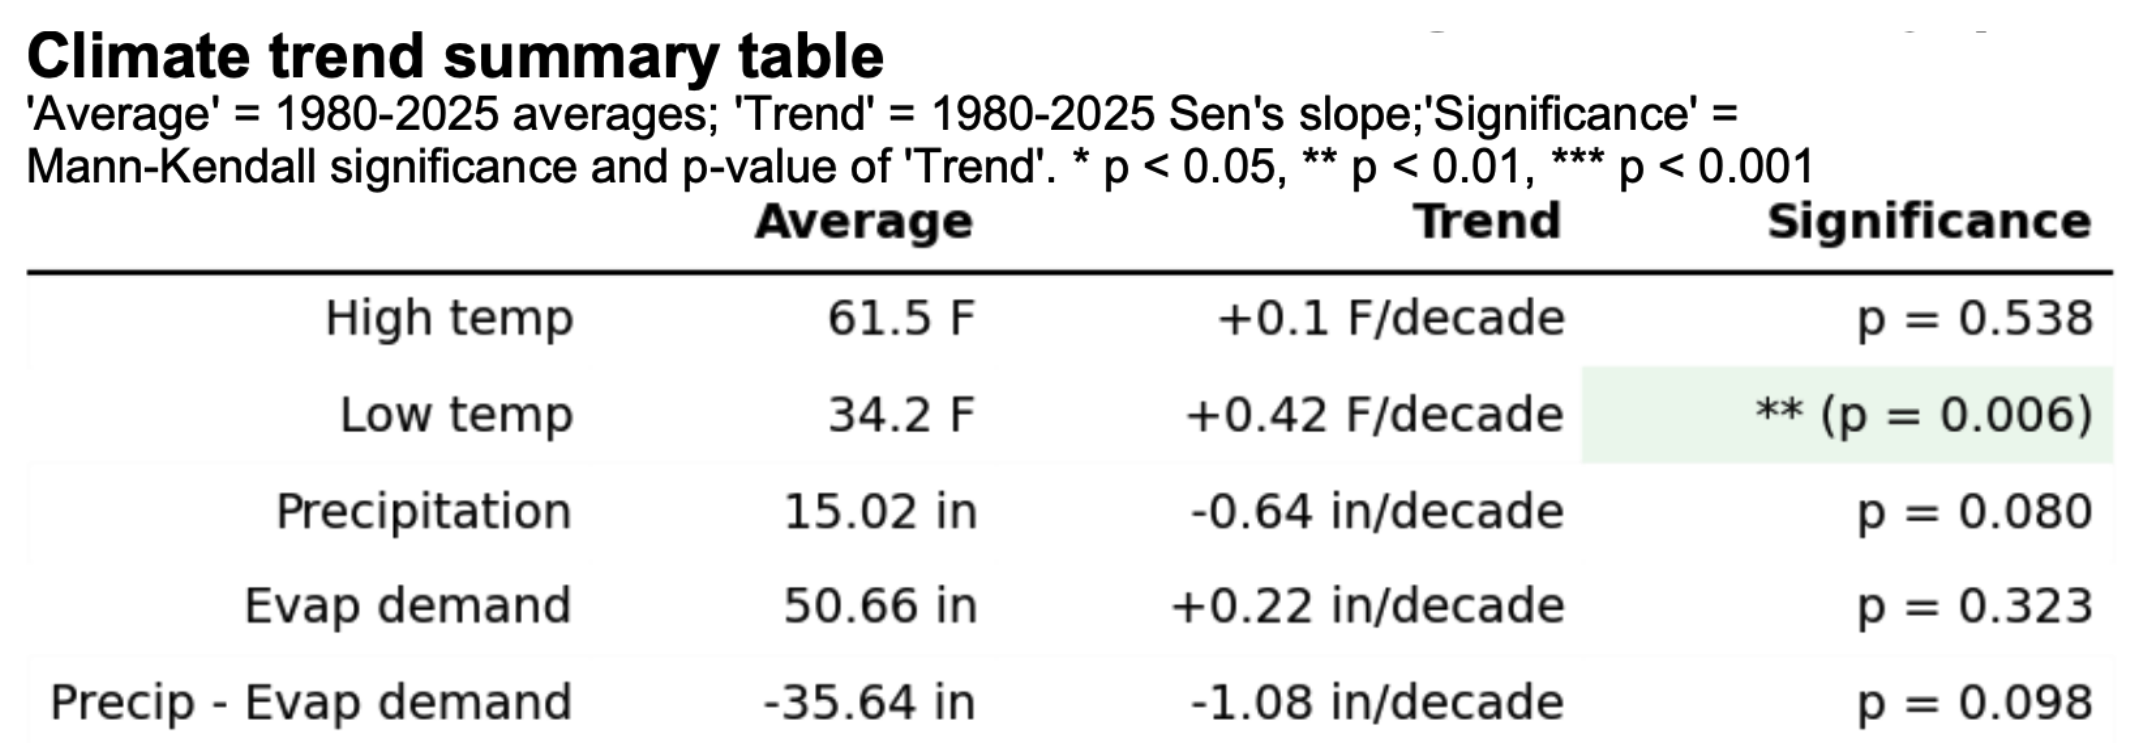
The table columns include:
- The 1980-through-previous-water-year average.
- The 1980-through-previous-water-year Sen's slope trend.
- The Mann-Kendall trend test significance value.
In this example, the area of interest shows a non-statistically significant negative trend in precipitation and a positive trend in evaporative demand. The only statistically significant trend reported for this unit was a positive increase in low temperature values.
Water Balance Timeseries
The Water balance timeseries figure plots annual water-year precipitation and evaporative demand for 1980 through the previous year, with trend lines added to highlight long-term directional changes over the period of record. This allows users to assess whether precipitation and evaporative demand have trended over time and to contextualize current conditions within a longer-term trajectory.
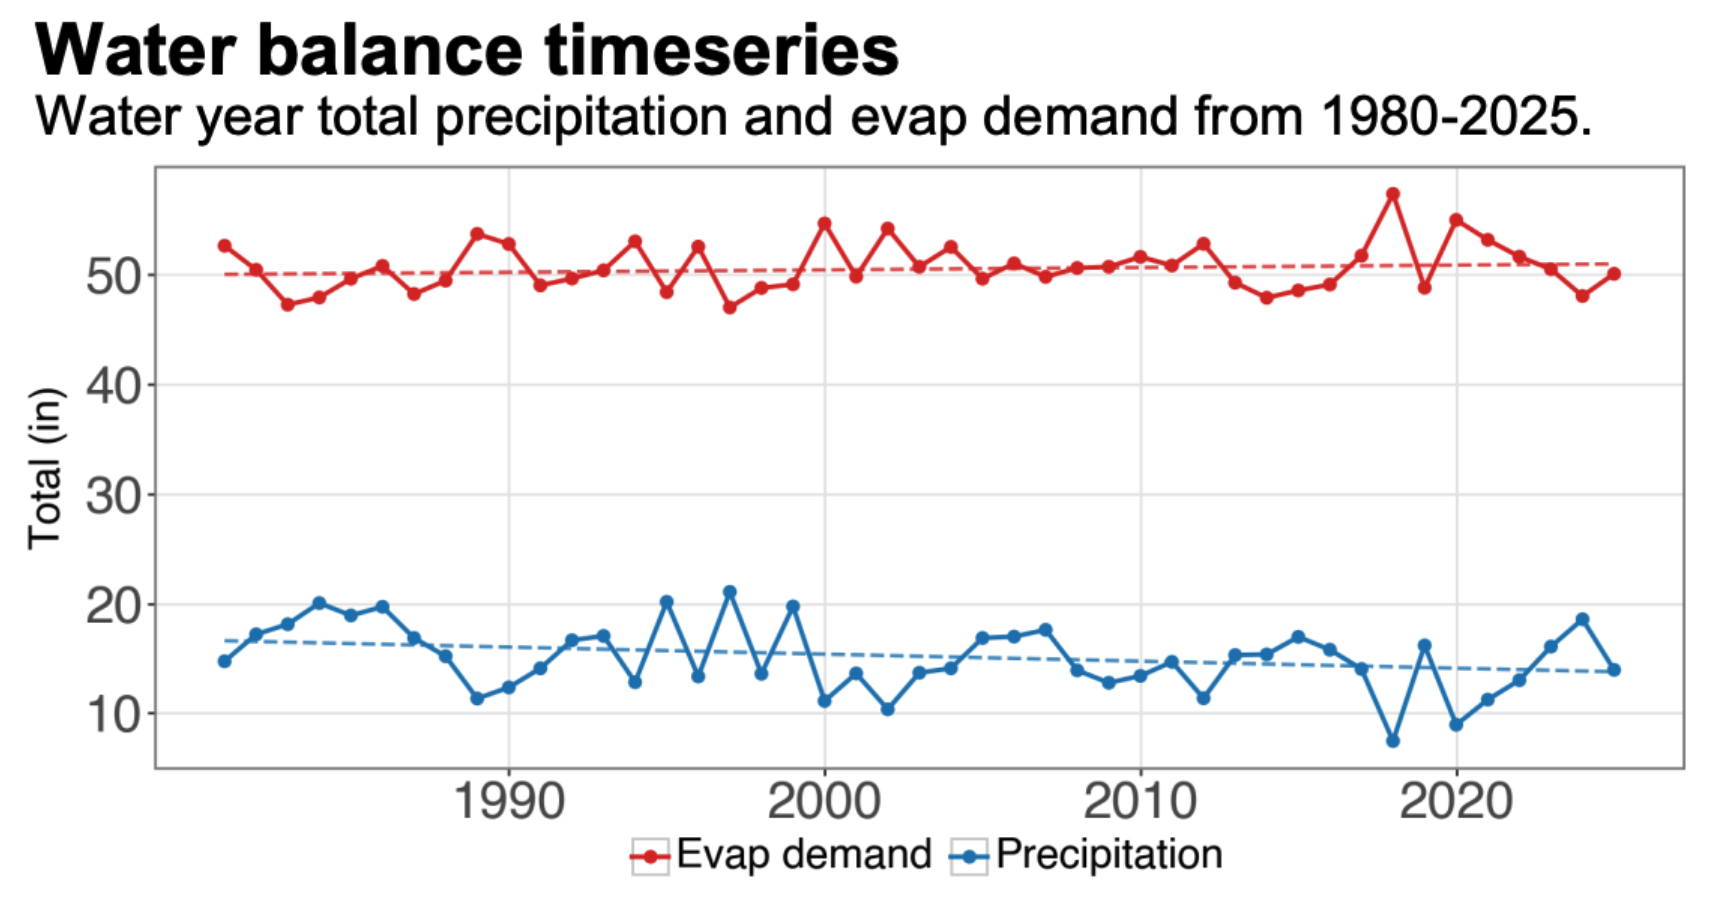
This example shows a long-term decrease in precipitation and a slight long-term increase in evaporative demand over the period of record, consistent with the drying signal summarized in the trend table.
Period-of-Record Drought Timeseries
The Period-of-record drought timeseries figure plots the long-term drought blend value at the end of each water year, capturing end-of-water-year conditions after the full seasonal balance of precipitation and evaporative demand has played out. Using a consistent annual snapshot date allows for meaningful year-to-year comparison, revealing long-term trajectories in drought conditions across the area of interest that single-year or seasonal views may obscure.
Each individual yearly datapoint is color-coded by the drought class it falls in, with colored stripes in the background indicating class thresholds. These classes and colors are consistent with those used in the drought maps in the Current Drought Conditions section of the report. Lower long-term drought blend values indicate drier conditions, while higher values indicate wetter conditions.
Note
The figure plots the long-term drought blend value near the end of each water year, using the closest gridMET Drought date to September 30. On non-leap years, this is October 2. On leap years, this is October 1.
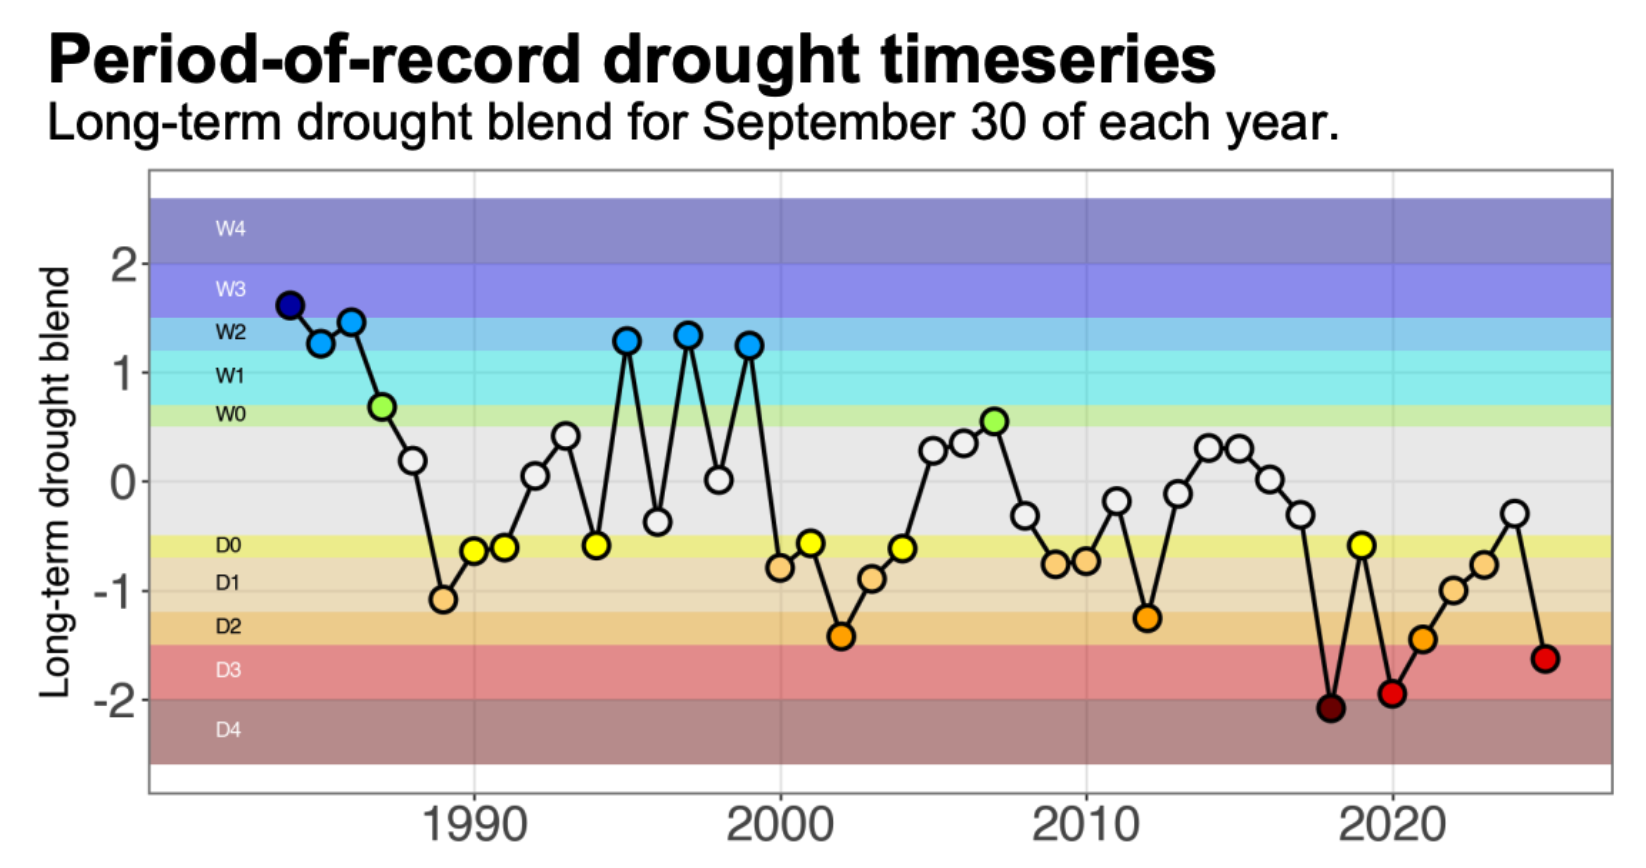
This example shows a drying trend across the area of interest consistent with the water balance timeseries trends. Notably, the last approximately eight years have consistently fallen within drought conditions, suggesting that this location has experienced pronounced and prolonged drying in recent years, which is likely affecting water, vegetation, and other resources.
Using the Drought Reports
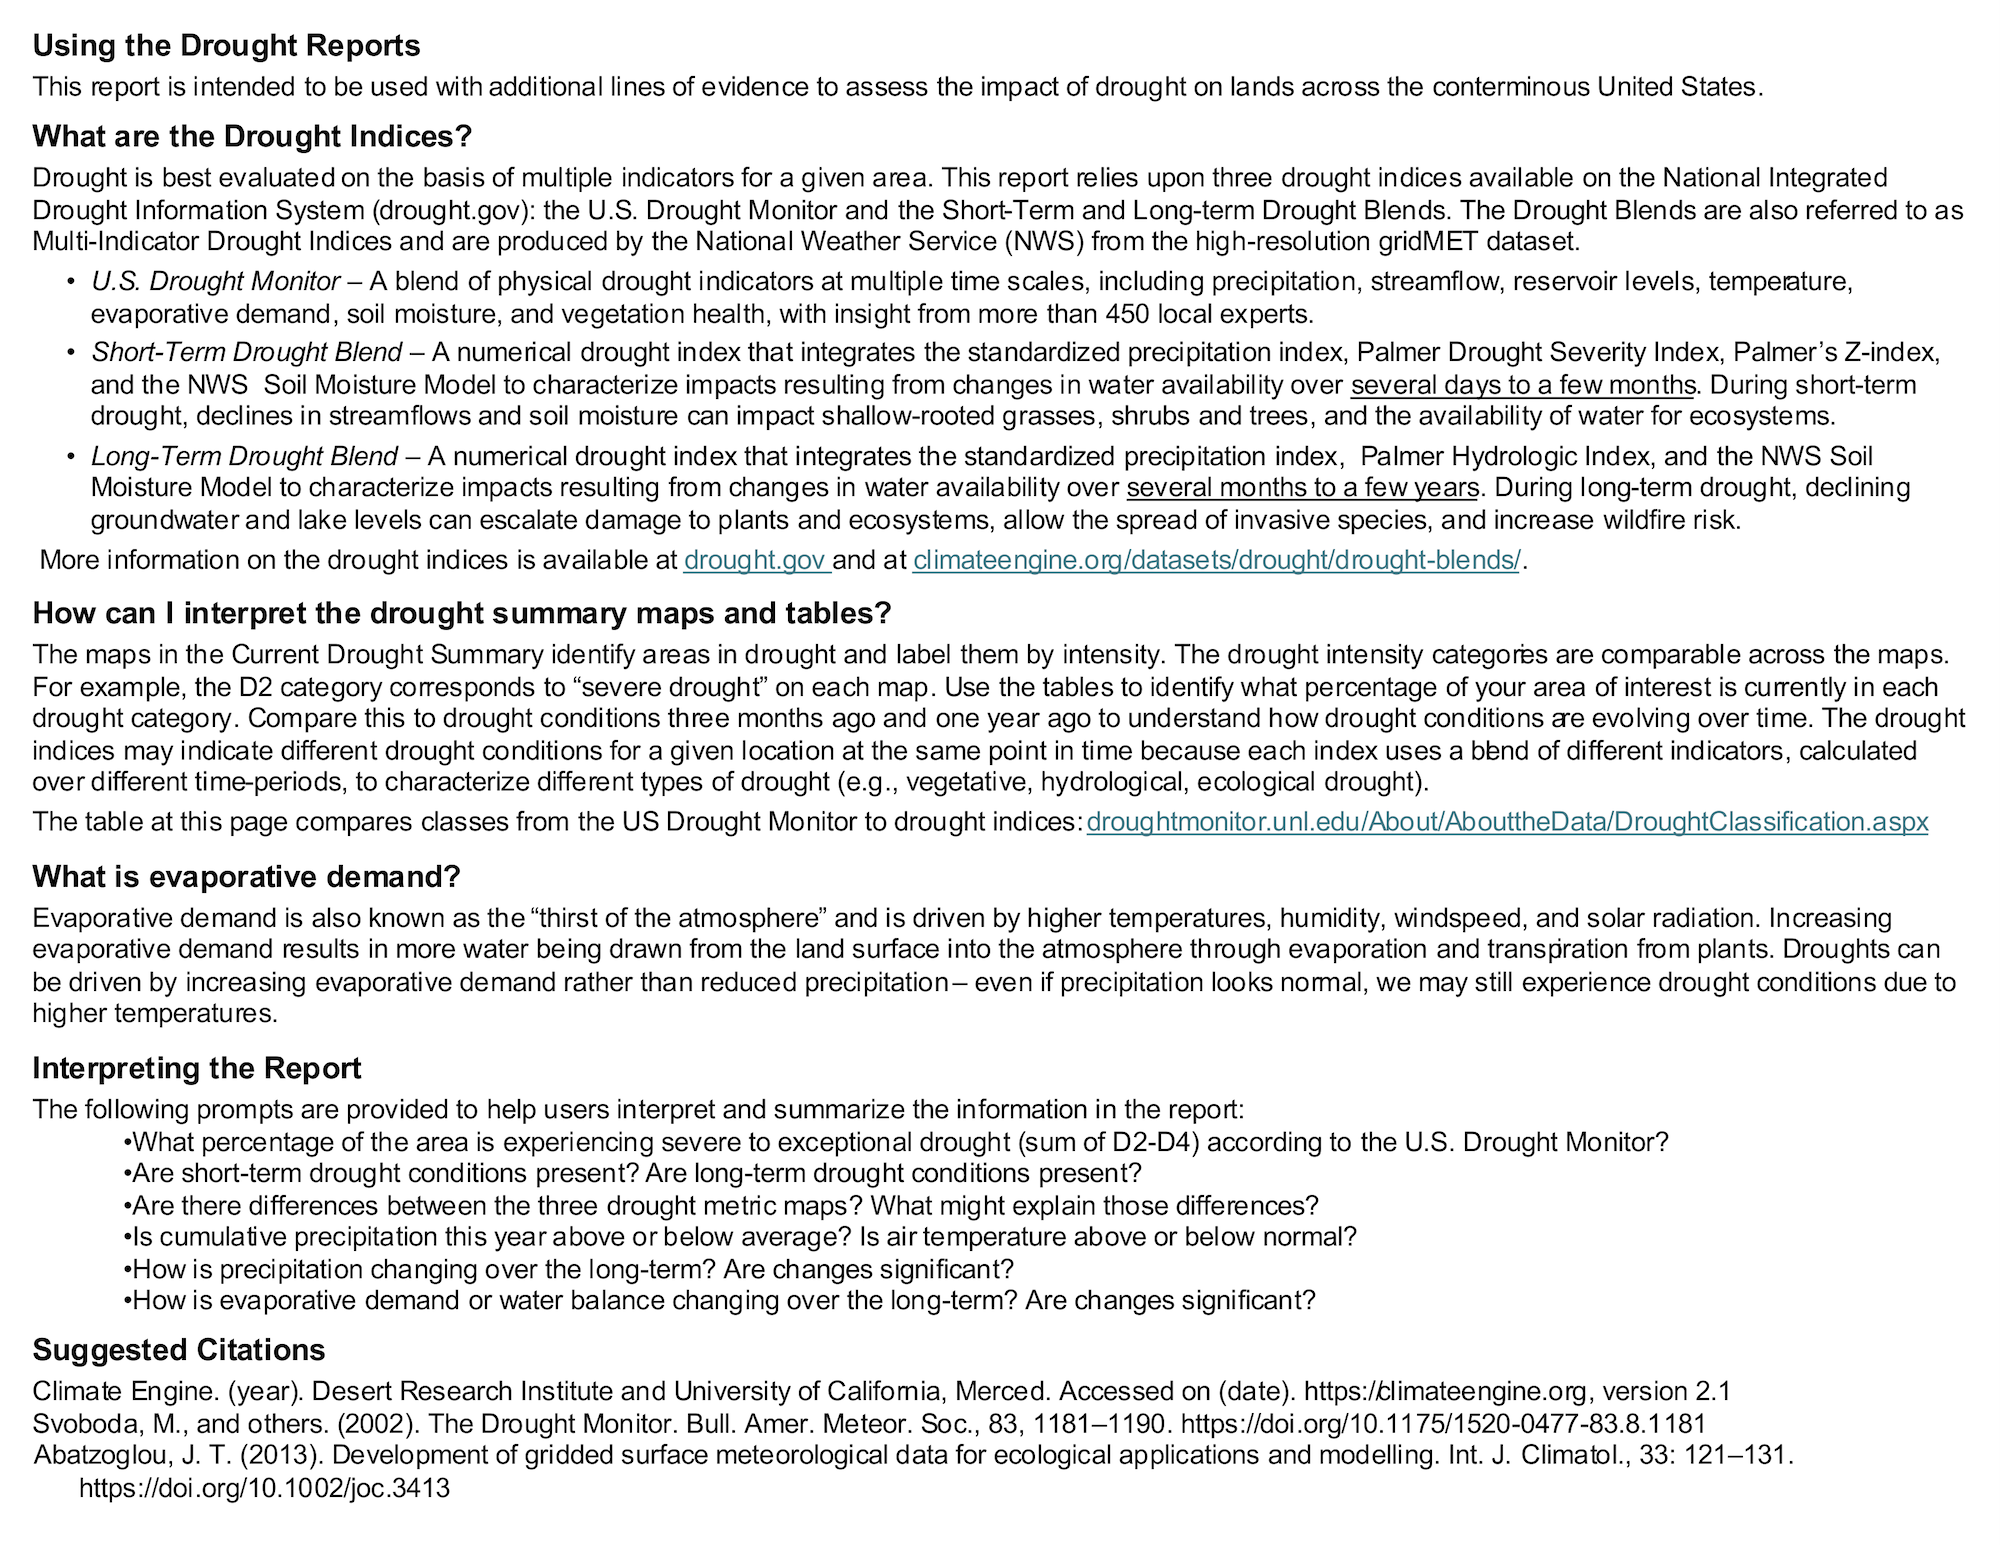
Another significant update for Version 2 is the inclusion of a second page in each report titled Using the Drought Reports. While this article provides more detailed information than can be published with each report, the second page ensures that every user has access to concise guidance for interpreting and applying the report.
The second page provides a compact interpretation guide, including definitions of the drought indices, guidance on how to compare maps and tables, an explanation of evaporative demand, suggested interpretation questions, and source citations.
Limitations and Appropriate Uses
These reports are intended to support drought screening, response planning, situational awareness, and discussion among managers, analysts, and local experts. They should be interpreted alongside field observations, local knowledge, water-supply information, vegetation monitoring, snowpack conditions, and other relevant datasets.
Differences among indicators are expected because each dataset represents drought from a different perspective, spatial resolution, update schedule, and methodological basis. Those differences can be useful when they help identify where drought signals are consistent across datasets and where additional interpretation or local information is needed.
Contributions
The Climate Engine Drought Reports version 2 were developed by the ClimateEngine.org team at Desert Research Institute in conjunction with staff from the Bureau of Land Management Headquarters and National Operations Center. These reports are referenced in the BLM's National Drought and Water Availability Instructional Memorandum as a resource for supporting drought response activities.