Introduction
In collaboration with the Mesic Resource Restoration Monitoring Aid (MRRMaid) team at Boise State University, the Climate Engine team has integrated MRRMaid data products into the Climate Engine App and API. This article will provide guidance on how to visualize and analyze these data using Climate Engine tools.
MRRMaid Monthly SF
Climate Engine App
This MRRMaid 10m monthly classification product shows mesic vegetation and surface water during the growing season. The classification includes upland, mesic vegetation, surface water, snow, and shadow and is available from June through September. Currently, these products are available for the High Divide region of Montana and Idaho and the MRRMaid team plans to expand the data extent to cover the sagebrush biome.
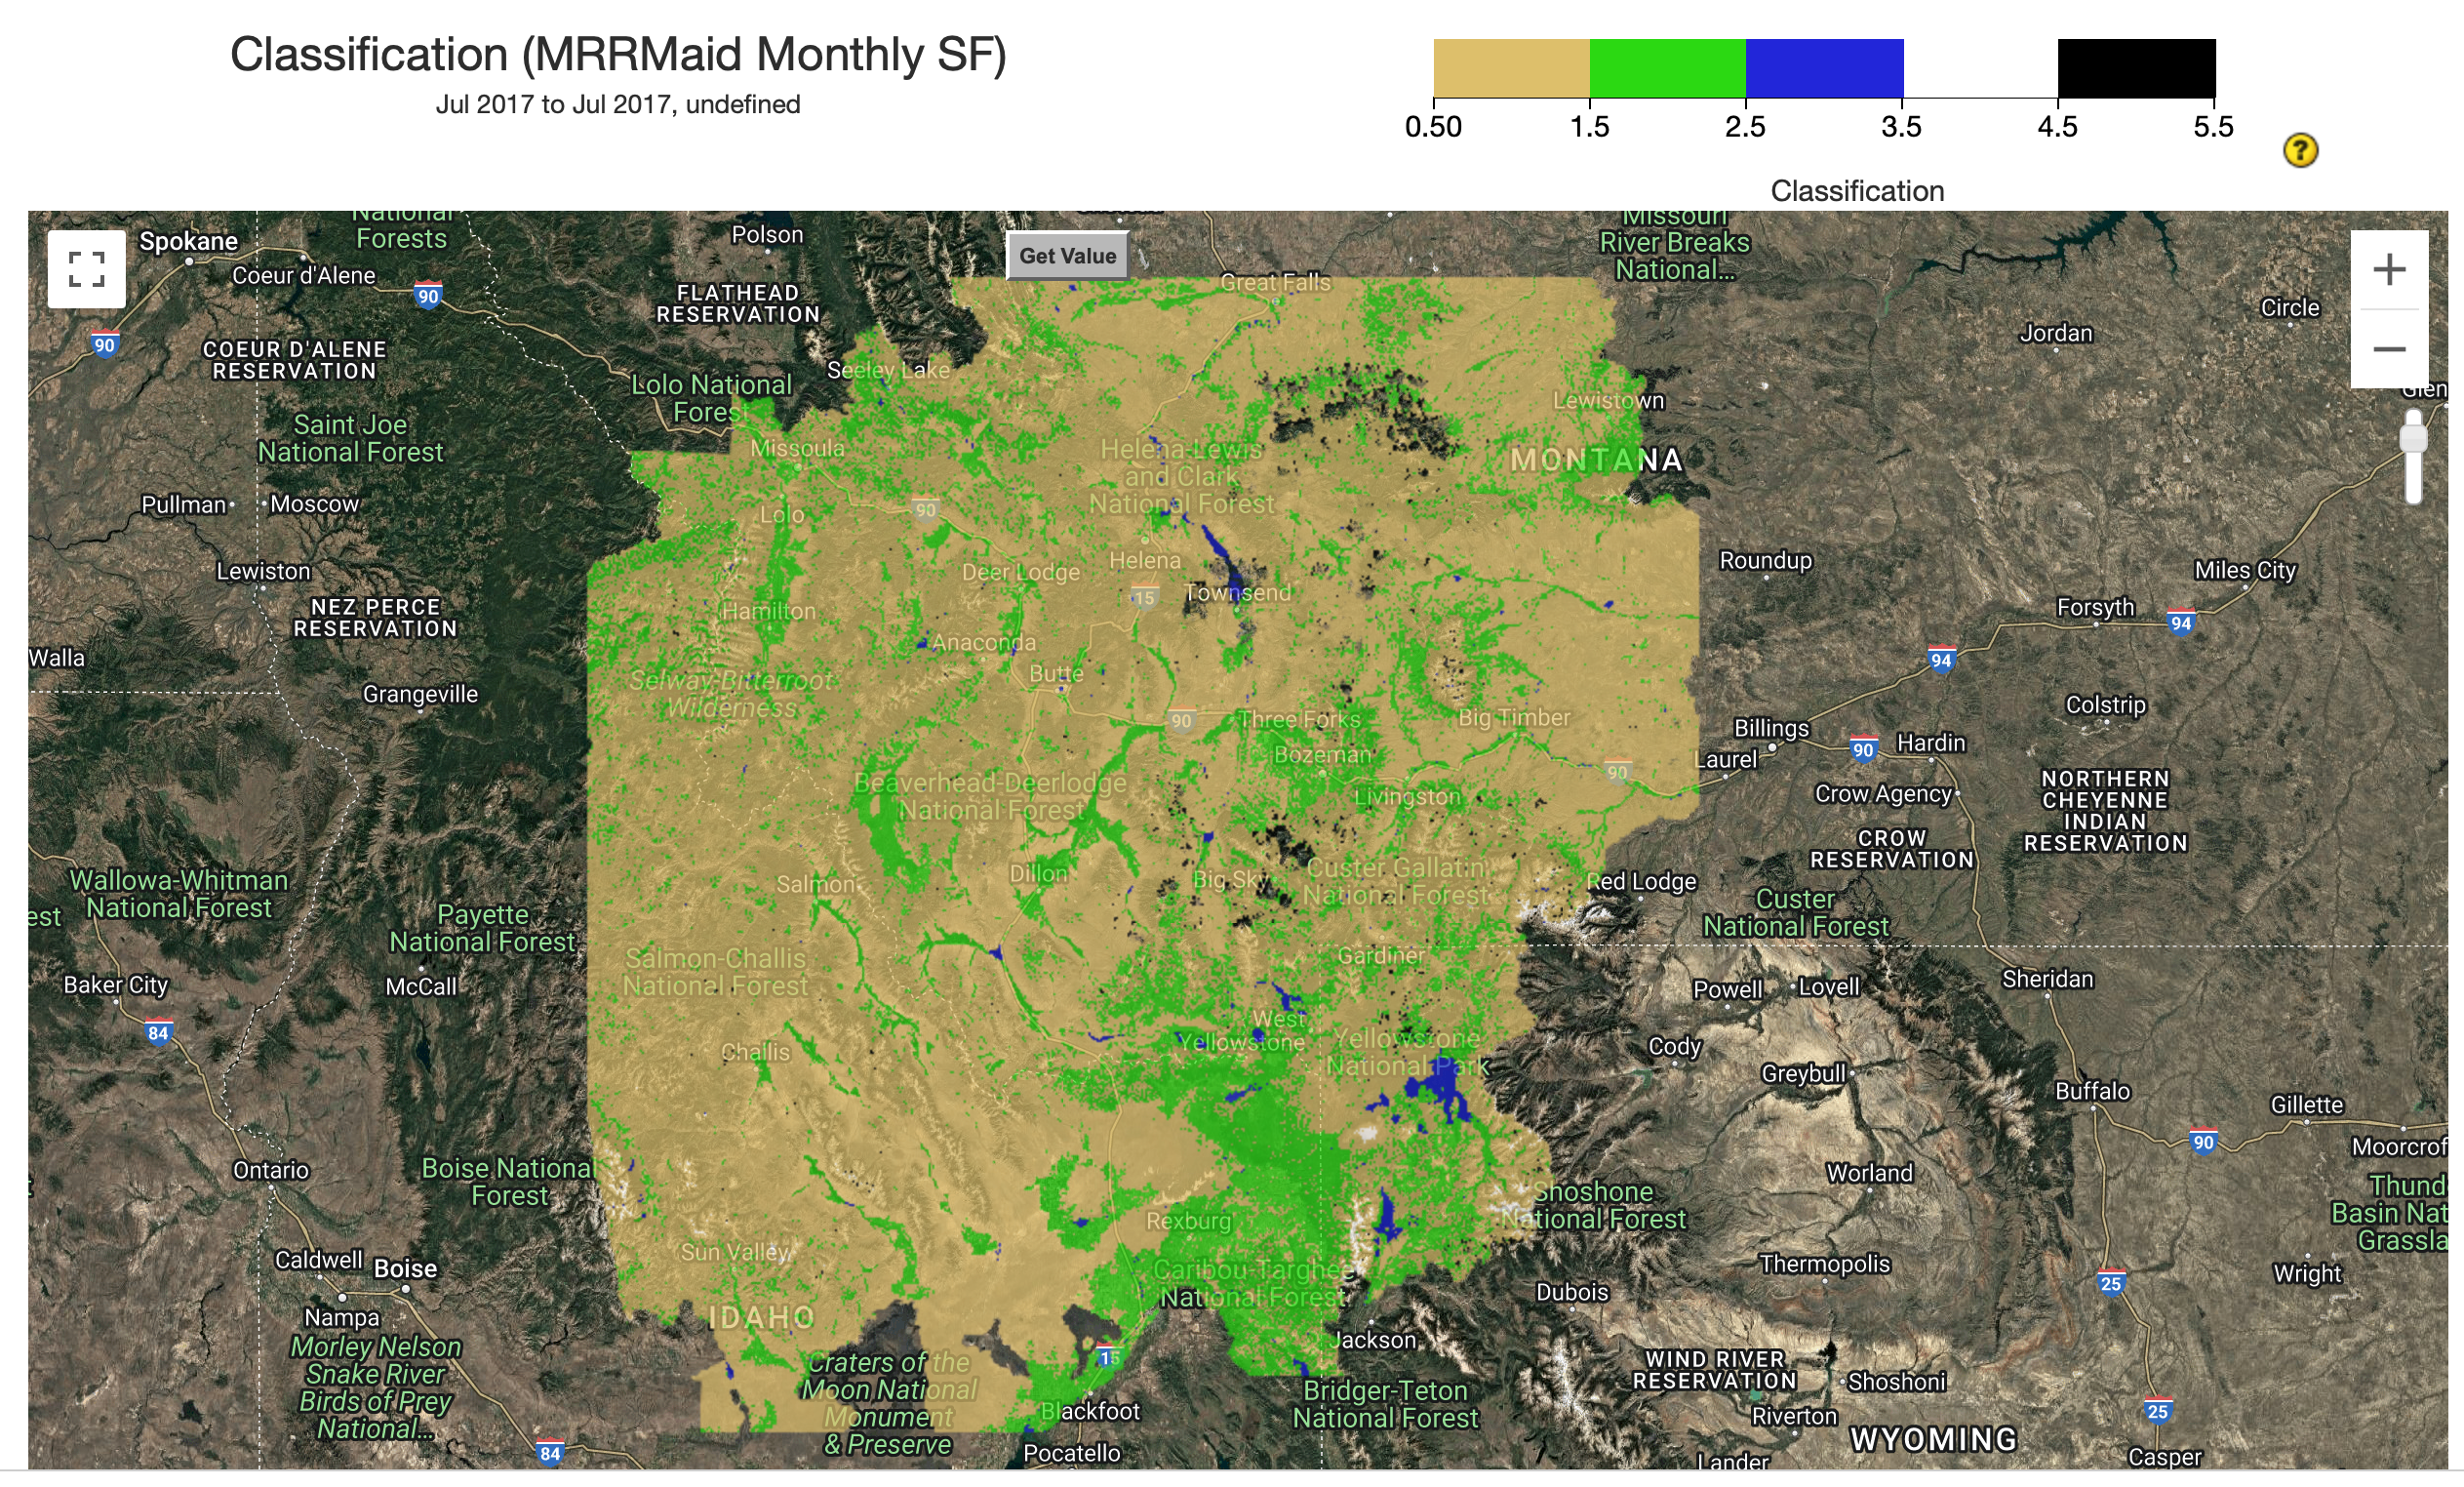 Mapping panel showing MRRMaid Monthly SF classification in Climate Engine.
In the mapping tab, users have the option to choose from four variable options, 1) the classification layer and binary layers of the 2) upland vegetation component, 3) mesic vegetation component, and 4) surface water. Since this is a classified product, the mapping calculation is limited to displaying the values represented as the mode (most frequent class) during the time period selected. To display a single monthly image, set the start month and end month dropdowns to the same month and year. Users can click the (?) to the right of the color bar to see a legend.
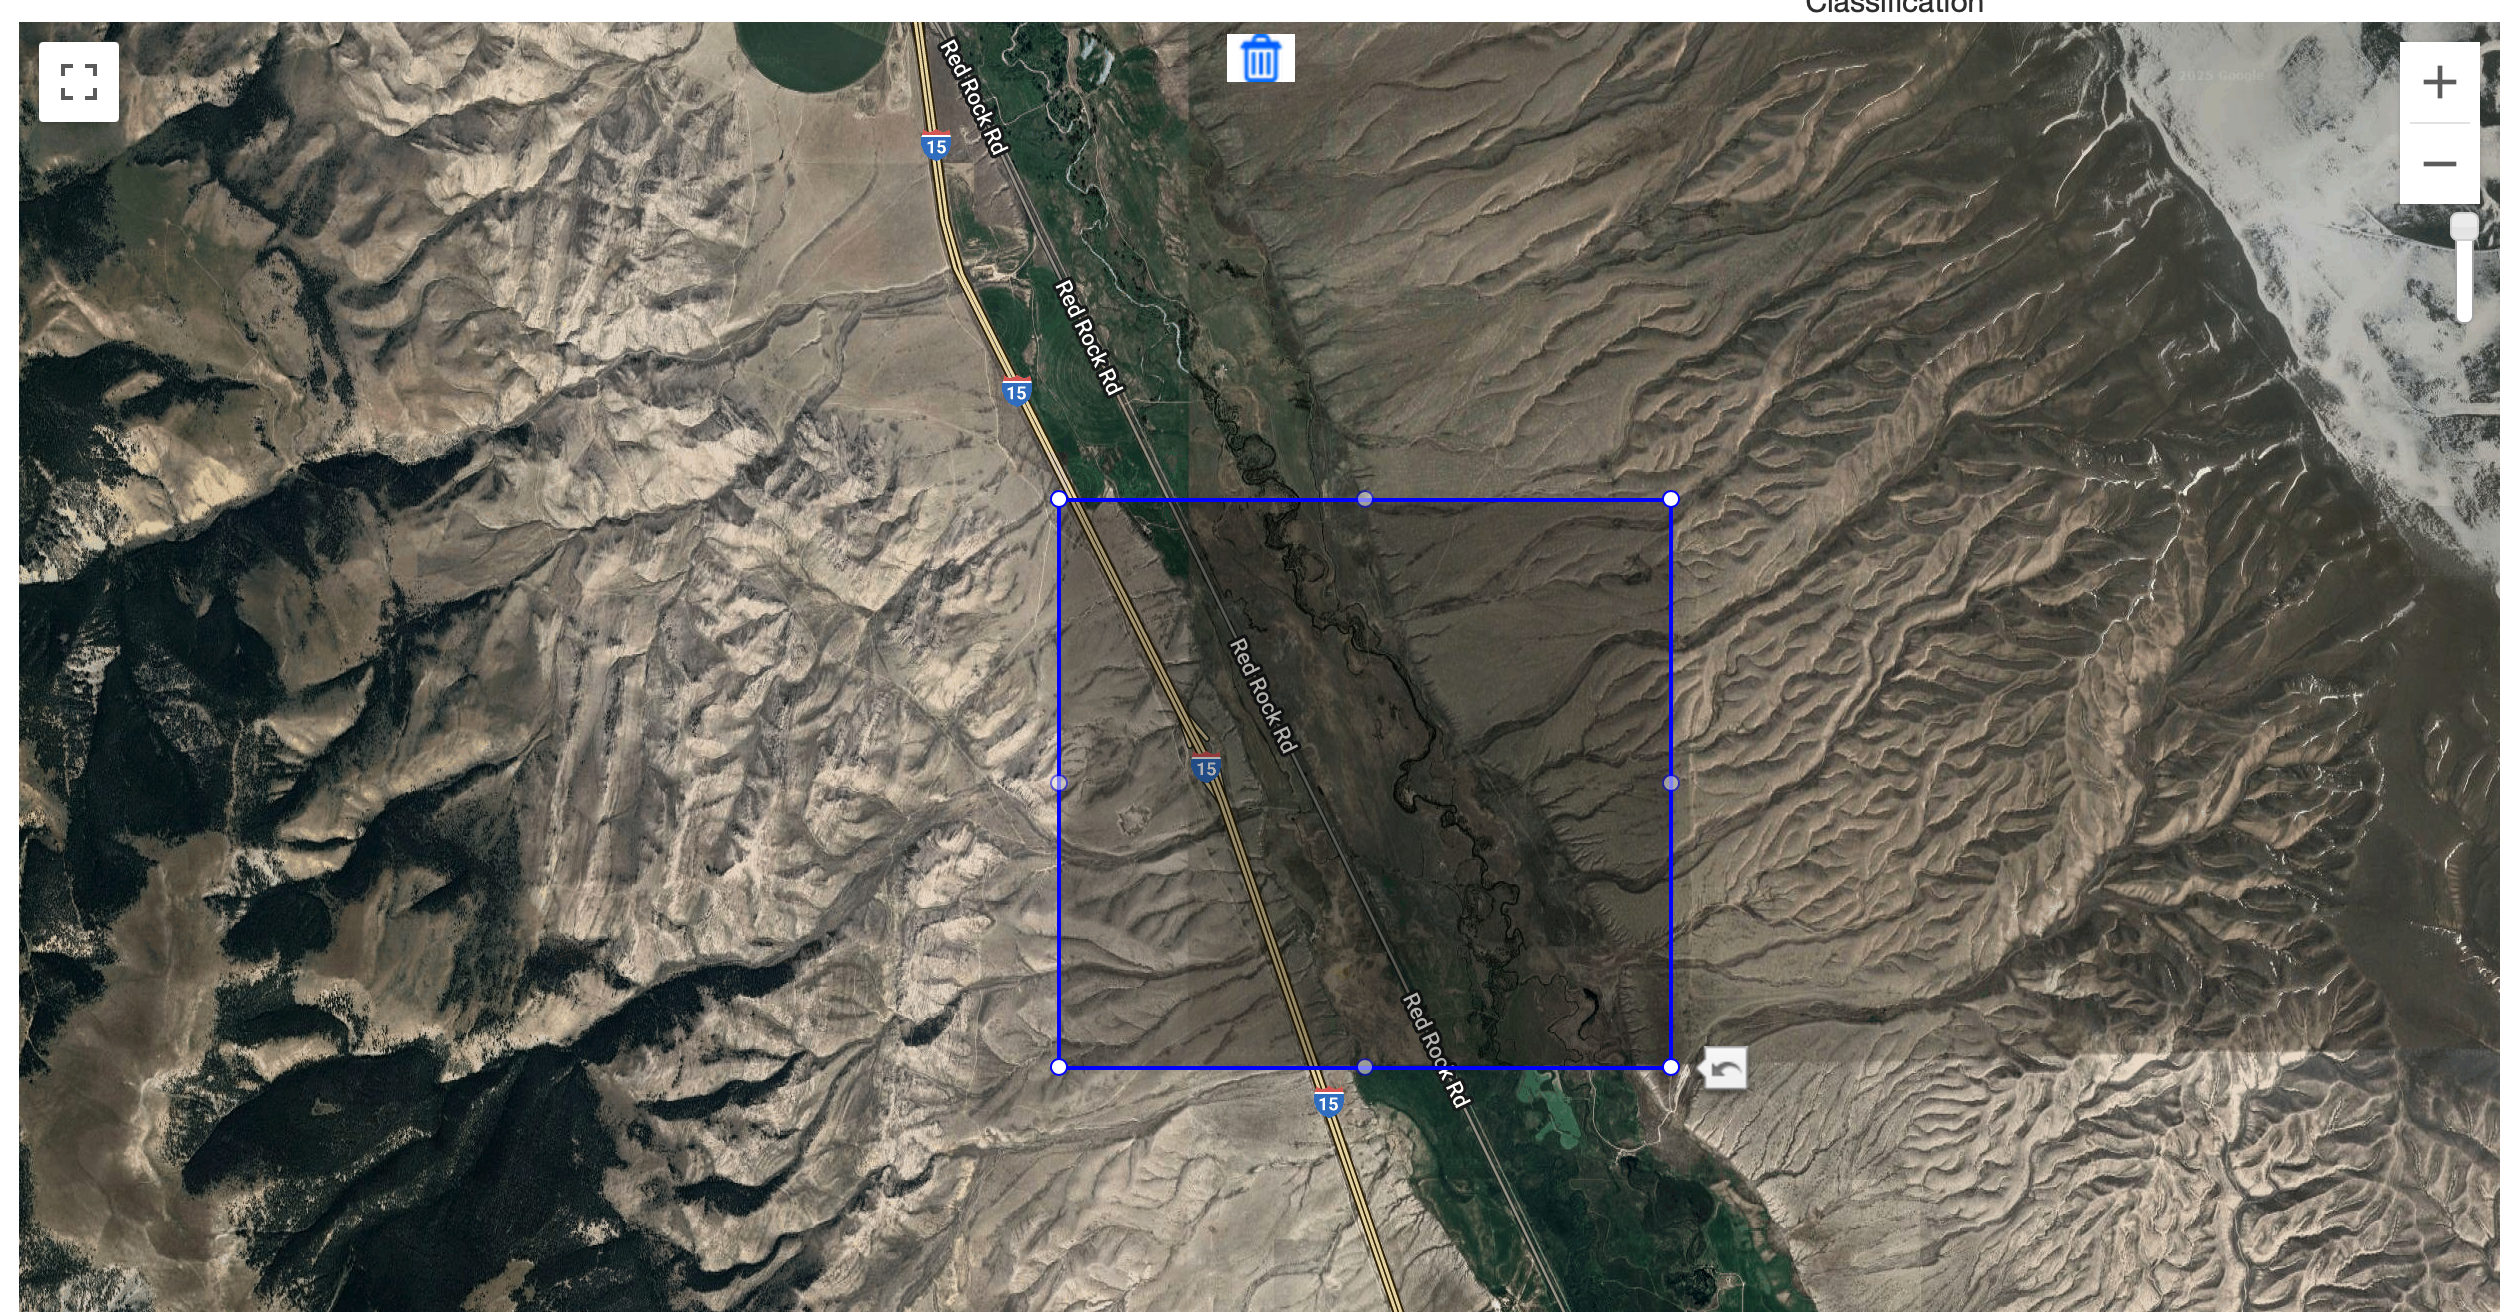 Polygon for timeseries summary in the Climate Engine App.
In the graphing tab, users can create timeseries plots of the proportion (fractional area) of the polygon mapped as the selected binary class, (e.g mesic). To produce the timeseries figure, users select a polygon as their region (shapefile upload, pre-loaded feature, or drawn polygon), select any of the binary variables, and set a month range. The proportions are then plotted as bar charts in the plotting panel as decimal values such that a value of 0.35 indicates that 35% of the selected polygon is mapped as the selected binary class. There are empty spaces between sections of bars because the dataset only has data for June - September of each year.
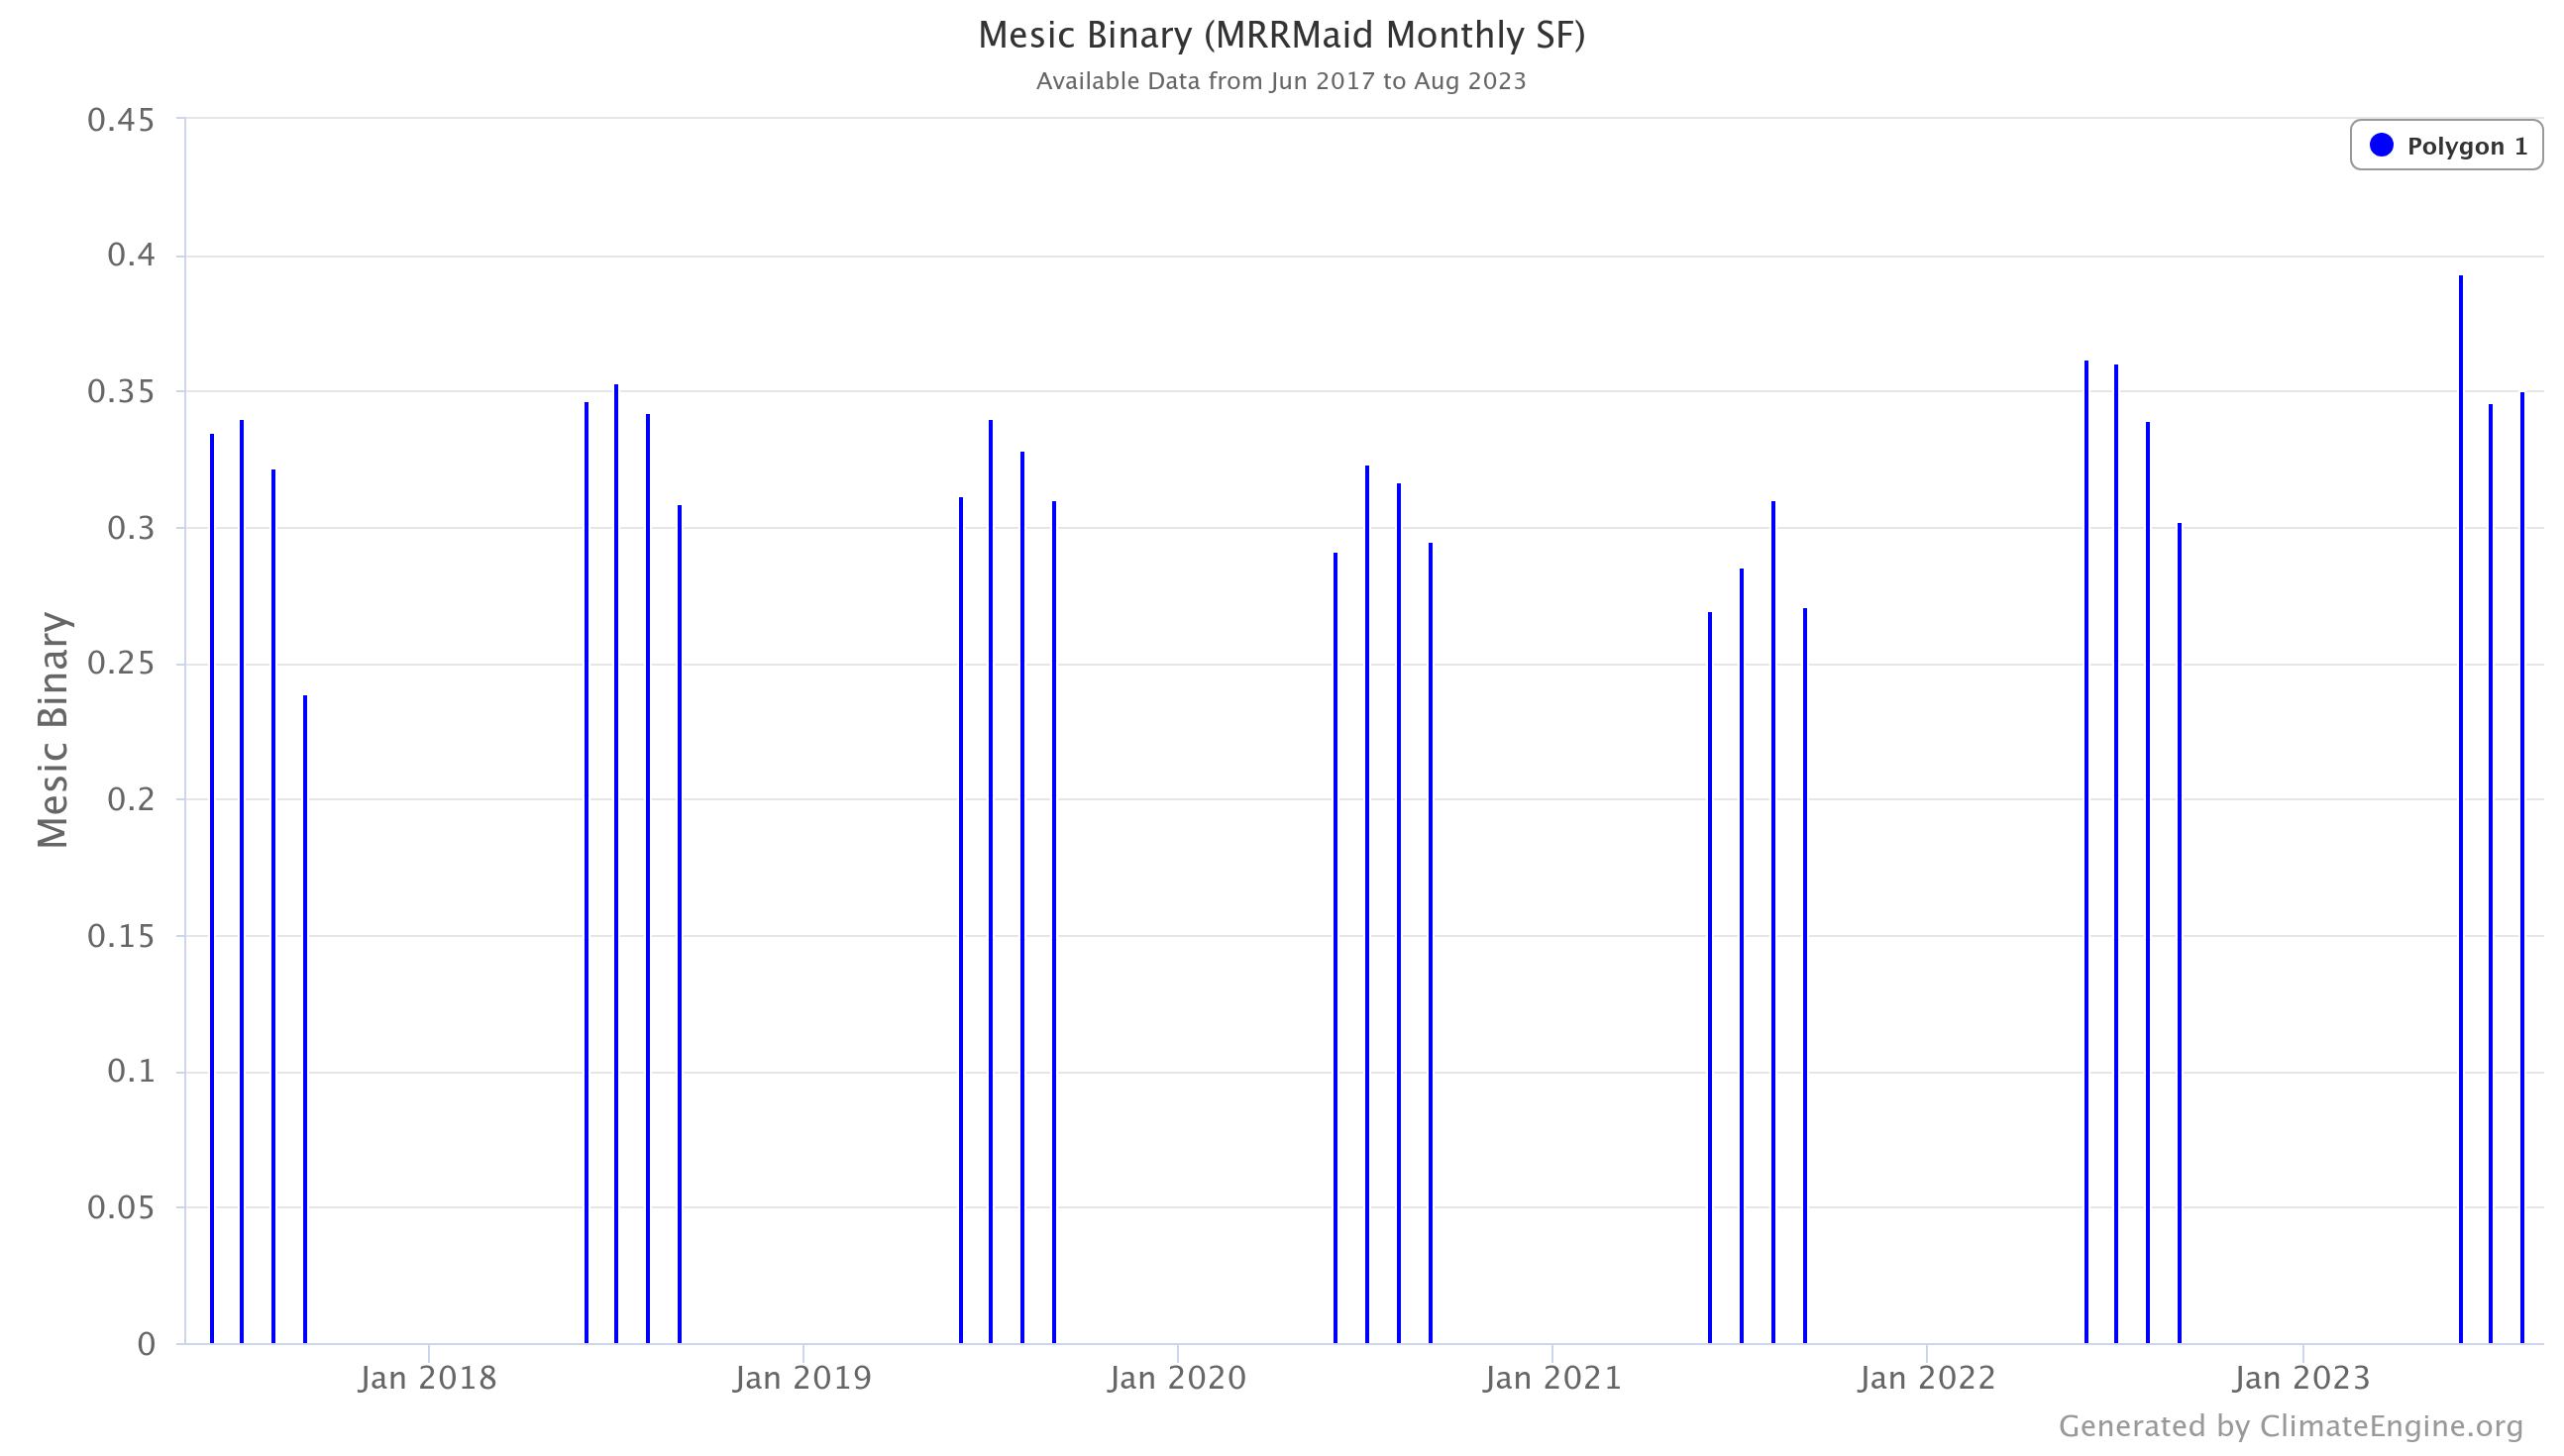 Plot of mesic vegetation from the Climate Engine App.
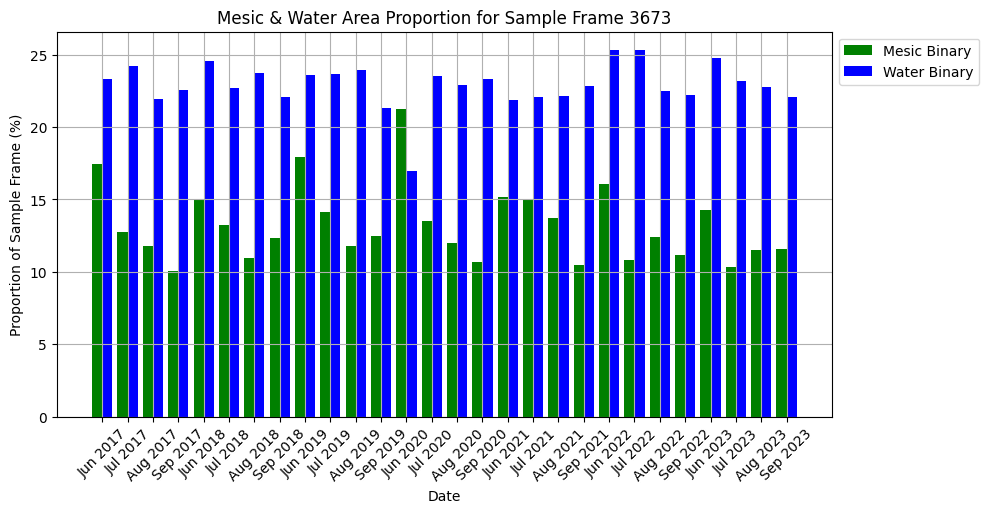
Users can use the two-variable analysis option in Climate Engine to plot mesic vegetation and water side by side over the time period. After producing the figure, be careful to compare the values of the two y-axes. By default, the y-axes are stretched to the range of values for each dataset in Climate Engine, so in the example below the range of values for mesic vegetation and surface water differ despite the bars being roughly the same height. Users can modify the y-axis range by using the "Graph" dropdown above the figure in the app.
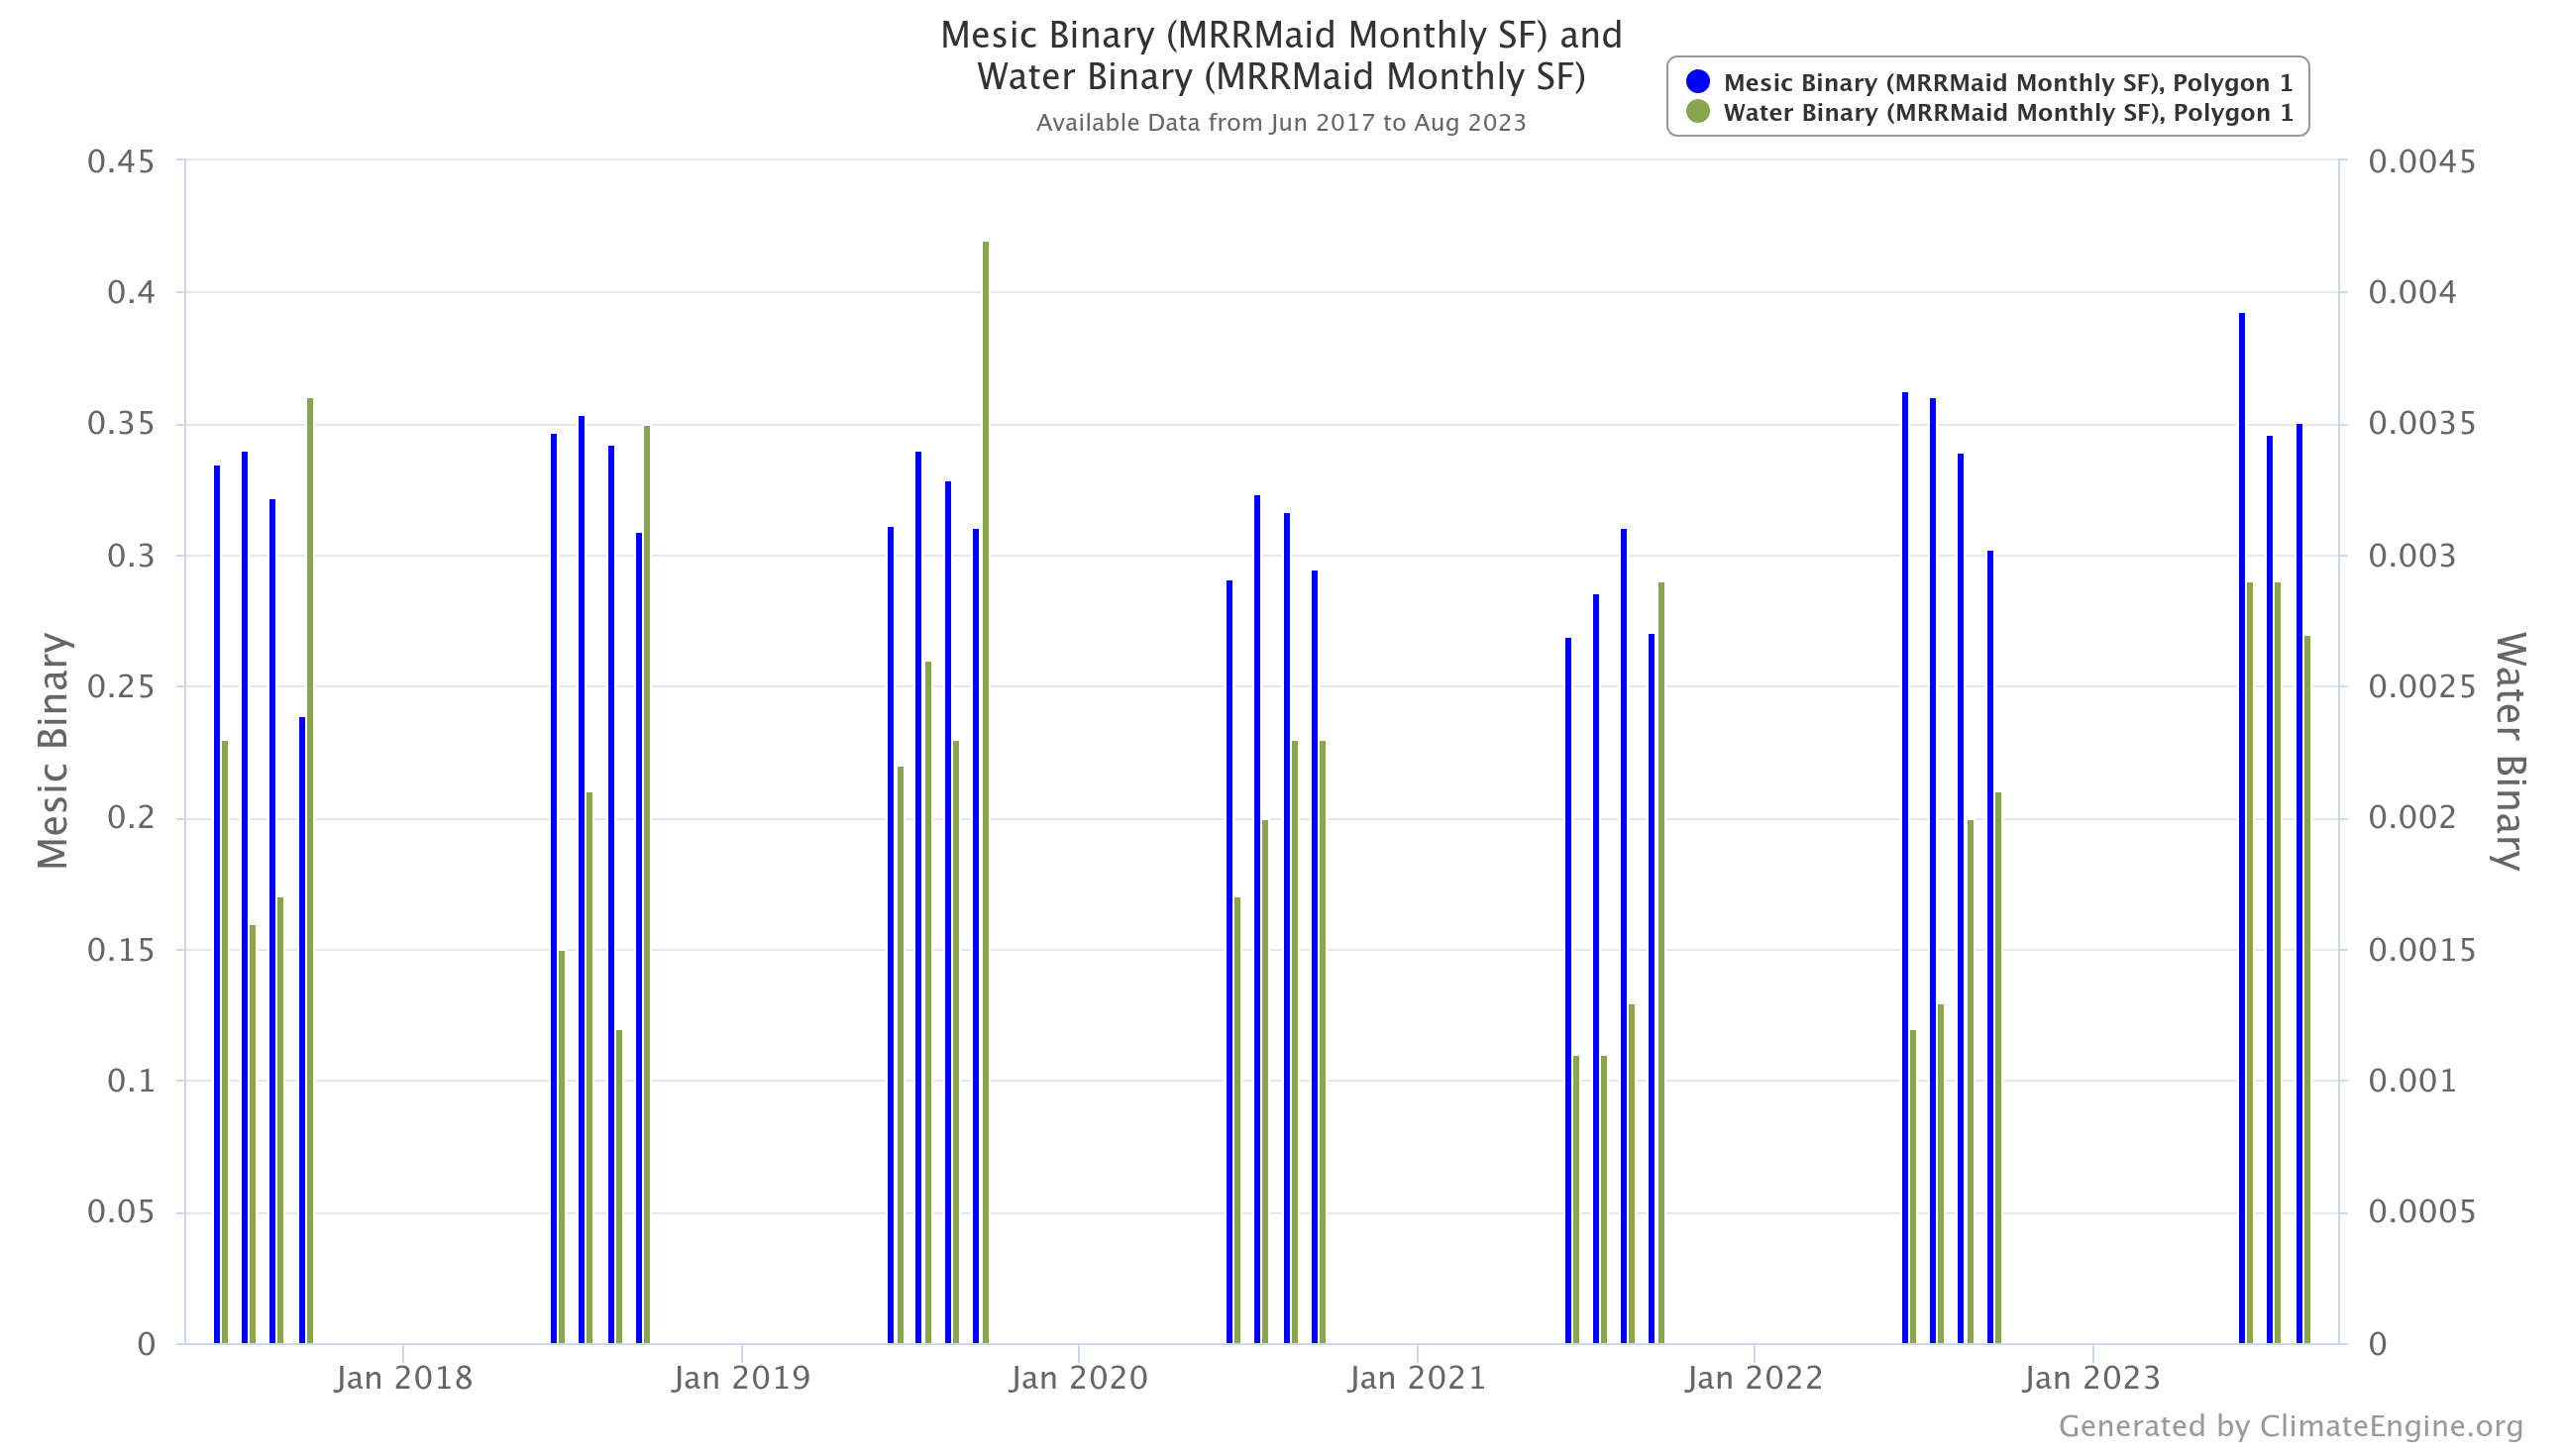 Two-variable plot of mesic vegetation and water from the Climate Engine App.
Climate Engine API
If you are interested in programmatically accessing and plotting the MRRMaid data, see this Climate Engine API tutorial. It walks users through 2 example workflows: 1) exporting a monthly raster to a google cloud storage bucket, copying it from the bucket, and plotting it using a python mapping package, and 2) requesting timeseries of proportion of polygon area mesic vegetation and water. Users will need to request an API key to run examples. See directions for requesting a key here.