GRACE Drought - 14km - Weekly
Description
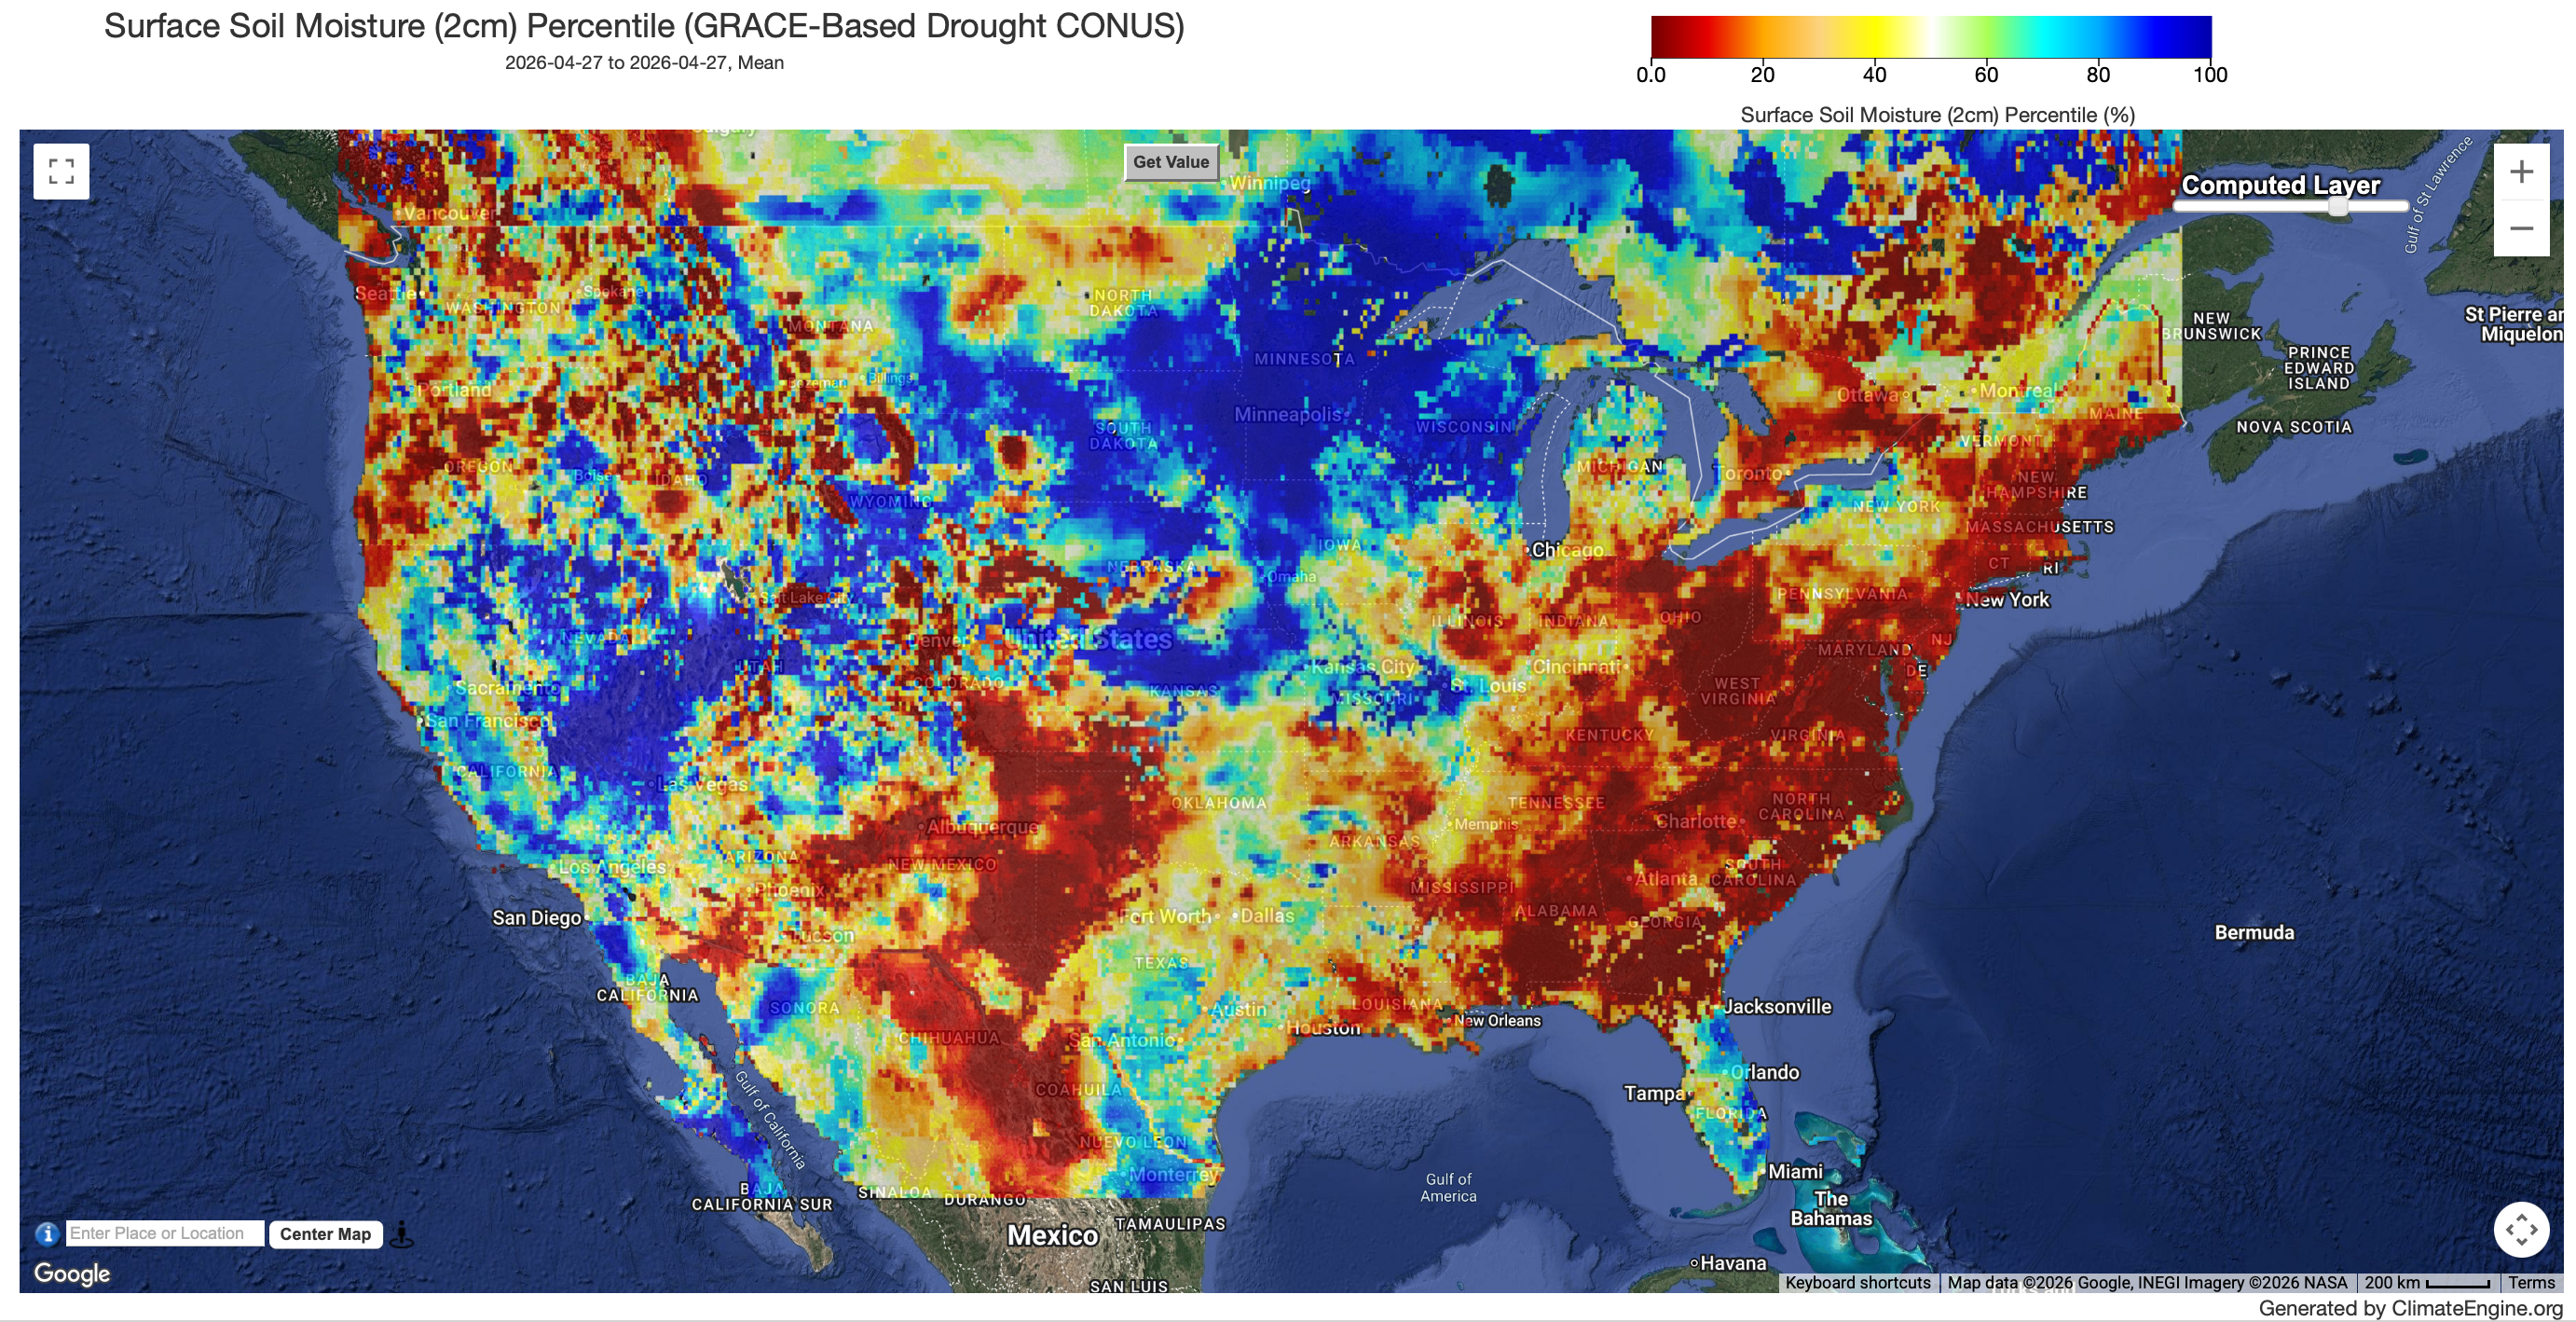
Scientists at NASAs Goddard Space Flight Center generate groundwater and soil moisture drought indicators each week. They are based on terrestrial water storage observations derived from GRACE-FO satellite data and integrated with other observations, using a sophisticated numerical model of land surface water and energy processes. The drought indicators describe current wet or dry conditions, expressed as a percentile showing the probability of occurrence for that particular location and time of year, with lower values (warm colors)meaning dryer than normal, and higher values (blues) meaning wetter than normal.
Climate Engine details
- Dataset type
- Remote Sensing
- Climate Engine ID
- GRACE_DROUGHT_CONUS
- Documentation
- No link provided
Dataset details
- Scale
- 14km
- Frequency
- Weekly
- Coverage
- CONUS
- Start year
- 2002
- End year
- Present
Earth Engine collection details
- Earth Engine asset
- projects/climate-engine-pro/assets/ce-grace-drought/conus
- Earth Engine source catalog
- ClimateEngine.org
Variables
API variable docs: tbd
| Name | Units |
|---|---|
| Root Zone Soil Moisture | percentile |
| Shallow Groundwater | percentile |
| Surface Soil Moisture | percentile |
References
- Houborg, Rasmus, et al. Drought indicators based on modelassimilated Gravity Recovery and Climate Experiment (GRACE) terrestrial water storage observations. Water Resources Research 48.7 (2012).
Website: https://nasagrace.unl.edu/Default.aspx
Terms of use
N/A